Use string equality to
see whether they are the same as human preproinsulin.
That is, write a short program
in my_insulin_test.py
to do this testing.
Download sequences.txt, which
has the above two sequences for copy-paste, as well as the sequences
needed for the exercises below. Report your results in your module pdf.
Next, let's consider the problem of approximate string matching:
Suppose we don't know the identity of the A and B chains
of the owl monkey.
We do know the human ones.
Thus, we'll solve this problem:
We're given the preproinsulin sequence of the owl monkey:
We want to know: which substring of the owl-monkey matches
the human B-chain most closely.
To do this, we will develop the idea of distance
between two strings.
Consider the following computation of string distance:
def distance(a, b):
    # Distance between strings a and b
    m = min(len(a), len(b))
    M = max(len(a), len(b))
    mismatches = 0
    for i in range(0, m):
        if a[i] != b[i]:
            mismatches += 1

    d = mismatches + (M - m)
    return d
3.53 Exercise:
Write the above in
my_stringdistance.py
and apply the distance measure to compare "bold" with each
of the following strings: "bald", "boy", "old". Report your
results in your module pdf, along with a rationale for the
distance function.
About string distance:
In general, there are many definitions of string distance.
The simple definition above failed for a simple "shifted"
string.
In fact, in computational biology, there are some
fairly complicated definitions that make use of statistics.
We'll use our simple distance measure to find the best
B-chain match within the owl monkey chain.
For example, suppose we compare the human B-chain
at the 5-th position of the owl-monkey preproinsulin:
To use the distance method we wrote earlier, we'd have
to extract the sub-string from the preproinsulin sequence.
Here's a program that makes the comparison at the 5-th position.
i = 5
owl_substr = owl_monkey_prepro[i:i+len(humanB)]
print(owl_substr)
d = distance(owl_substr, humanB)
print('distance=', d, 'at position', i)
3.54 Exercise:
In
my_stringdistance2.py,
expand on the above code to search all possible positions
in the owl-monkey preproinsulin and find the best possible
match (with the least distance) for the human B-chain.
Print the position where this occurs, and the distance.
Report these numbers in your module pdf.
3.55 Exercise:
In
my_stringdistance3.py,
try the same thing with a few non-primates. That is, try to look
for the closest match to the human B-chain in in each of the
preproinsulin sequences below. Before
running your code, which of the three do you expect
to produce a result closest to human? Farthest?
Even when a mismatch looks very difficult, it is
possible to identify reasonable matches.
⇒ This is the subject of advanced techniques in computational biology.
More interestingly, such simple sequence comparisons can
reveal much about evolution (the subject of phylogenetics) and
even human history (through the study of ancient DNA).
We've only scratched the surface of a large field
called bioinformatics, with surprisingly many interesting
computational problems.
Although our examples have been about protein
sequences (with a 20-letter alphabet), the same
"string search" ideas more or less apply to DNA sequences
(which have a 4-letter alphabet).
Part B: A whale of a story
We will examine a dataset derived from tracking bluefin whales off of
the California coast.
To start with, let's look at the data, load the data and print its
size (number of rows, number of columns):
from datatool import datatool
import numpy

dt = datatool()

dt.load_csv('bluefin_whale_data.csv')

# Extract into 2D array:
D = dt.get_data_as_array()

# Print number of rows, columns:
print('# rows=', D.shape[0], '# columns=', D.shape[1])

# The lat-long from the first row:
print('first lat=', D[0,4], 'first long=', D[0,3])
3.57 Exercise:
Download bluefin_whale_data.csv
and
datatool.py
and then in
my_bluefin_whales.py,
type up the above and run. Examine the CSV file.
Note:
We've extracted the data into a 2D array. Here we used
the
shape
parameter of the array to print the size. Recall:
shape[0]: number of rows
shape[1]: number of columns
The array will be useful when we use loops to look through
the data.
Notice that the latitude is in the 5th column, while the
longitude is in the 4th column.
Although there's a lot of other data, the one that will be
of interest is an identifier that distinguishes one whale from another.
In this case, the 11-th column identifies the whale.
Next, let's count and identify the different whales.
To do this, we will use a set because a set only allows
unique elements:
from datatool import datatool
import numpy
import math

dt = datatool()

dt.load_csv('bluefin_whale_data.csv')

D = dt.get_data_as_array()
print('# rows=',D.shape[0], '# columns=', D.shape[1])

# Start with an empty set
whales = set()

# Now add the whale in each row
for i in range(D.shape[0]):
    whales.add(D[i,10])

# Write a line of code to print the size of the set:
3.58 Exercise:
Write up the above in
my_bluefin_whales2.py
and add the line needed to print the size of the set. You should see
13 whales in total.
Next, let's identify the minimum and maximum latitudes
to know the range of area where the data was collected:
from datatool import datatool
import numpy
import math

dt = datatool()

dt.load_csv('bluefin_whale_data.csv')

D = dt.get_data_as_array()

# Write code to identify the min and max
# latitudes and longitudes. The latitude is in 5th column,
# while the longitude is in the 4th column.
min_lat = D[0,4]
max_lat = D[0,4]
min_long = D[0,3]
max_long = D[0,3]

# WRITE YOUR LOOP HERE:


print('min-lat=', min_lat, 'max-lat=', max_lat)
print('min-long=', min_long, 'max-long=', max_long)
# Should print
# min-lat= 31.0522 max-lat= 40.4511
# min-long= -124.9586 max-long= -116.509

# Round the min's down using math.floor() and
# round the max's up using math.ceil()

# WRITE YOUR CODE HERE:

# Print rounded min's and max's:
print('min-lat=', min_lat, 'max-lat=', max_lat)
print('min-long=', min_long, 'max-long=', max_long)
# Should print
# min-lat= 31 max-lat= 41
# min-long= -125 max-long= -116
from datatool import datatool
import numpy
dt = datatool()
dt.load_csv('bluefin_whale_data.csv')
dt.tilemap_attach_col_lat_long('location-lat', 'location-long', 'individual-local-identifier')
# We'll draw a square over the map.
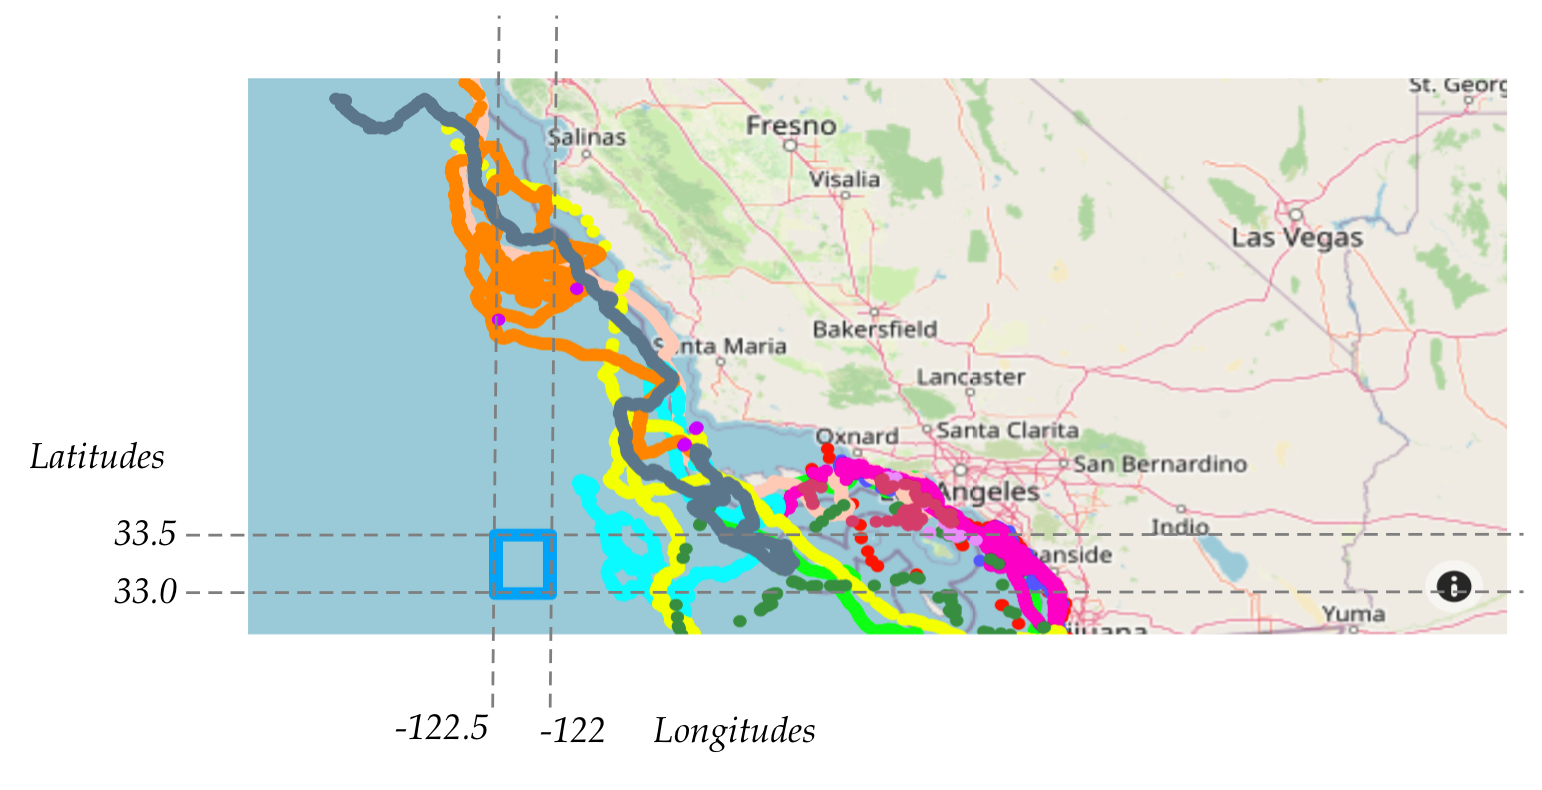
dt.tilemap_add_line(33, -122.5, 33.5, -122.5)
dt.tilemap_add_line(33, -122.5, 33, -122.0)
dt.tilemap_add_line(33, -122.0, 33.5, -122.0)
dt.tilemap_add_line(33.5, -122.5, 33.5, -122.0)
center = dict(lat = 35, lon =-119)
dt.tilemap_czt(center, zoom=5, title='Bluefin whale tracks')
dt.display()
3.60 Exercise:
Download and try out
my_bluefin_whales4.py.
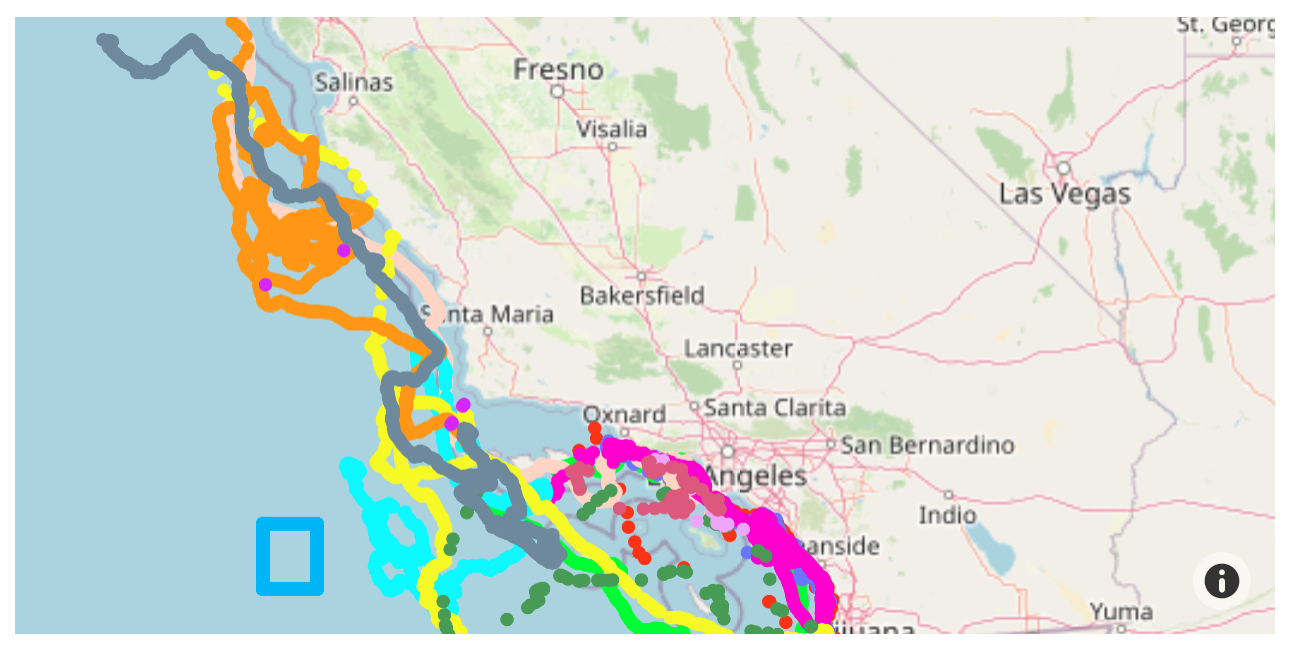
You should see something like
Note:
Each whale has its own color, and one can see the tracks each
has made.
We drew a small box to demonstrate drawing a box.
Notice that the box size is a half-latitude in height
and half-longitude in width.
Thus far we haven't done much that's computational.
Let's now solve a realistic problem:
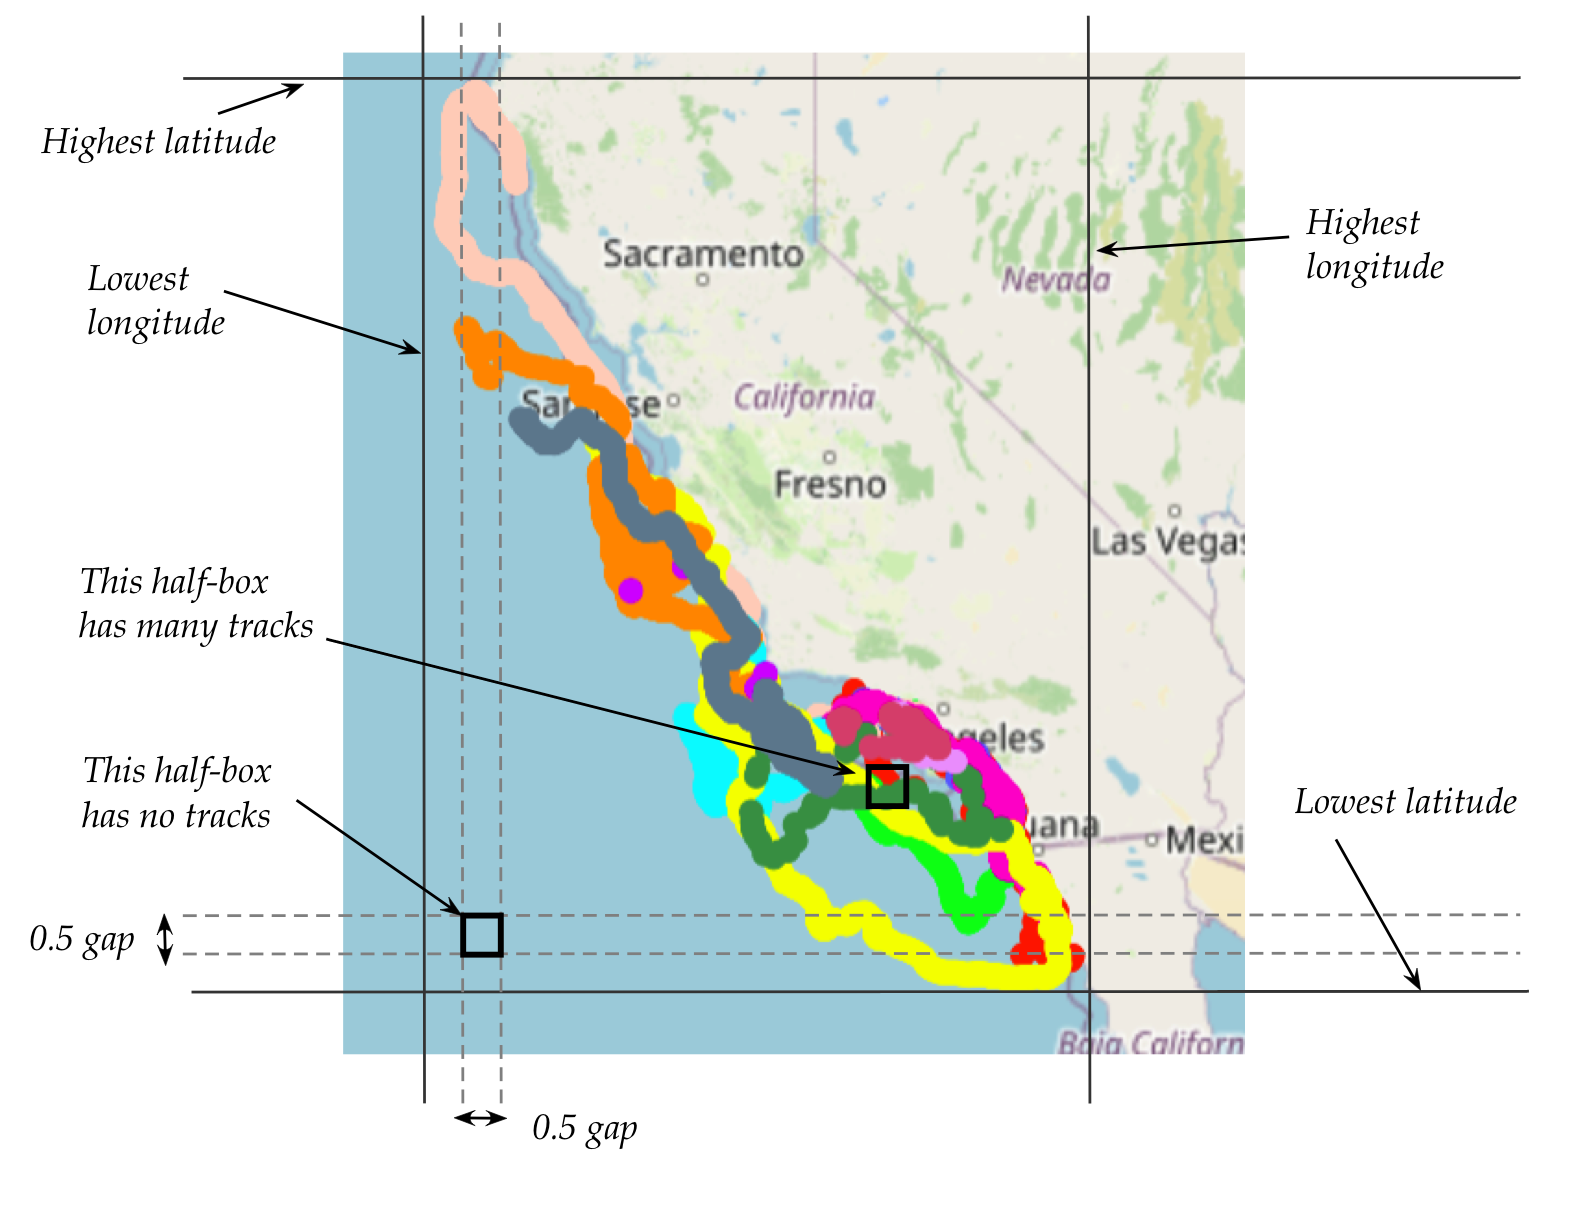
We've calculated and rounded (up or down) the min and max of
the latitudes and longitudes of the whale locations.
We've also drawn a half-box: a box half-latitude in height
and half-longitude in width.
The goal in the problem: find the half-box with the most
whale tracks.
Such a box might suggest a good spot for a research vessel looking
to retrieve trackers and study the whales.
We will do this by trying all possible half-boxes in the
region delimited by the min and max we've already found for latitude
and longitude.
The main idea is expressed in this nested loop:
# Outer loop over latitudes
lat = min_lat
while lat < max_lat:
    # Inner loop over longitudes
    lon = min_long
    while lon < max_long:
        # Count occurrences within lat to lat+0.5, lon to lon+0.5
        count = count_occurences(lat, lon)

        # Update highest count so far ... (code not shown) ...

        lon += 0.5             # Inner-loop
    lat += 0.5                 # Outer-loop
3.61 Exercise:
Download
my_bluefin_whales5.py
which has instructions on where to write code. All you need to do is
fill in some functions. The desired output is also described.
3.62 Exercise:
Download
my_bluefin_whales6.py,
which will visualize the "best half-box" on a map. Copy over the
missing code from the exercise above. You should see a box that's
slightly west of Long Beach, CA, and northwest of Catalina Island,
which seems to match a description of the
local whale-watching tours.
3.63 Video:
Optional further exploration
If you'd like to explore further:
See this
TED talk for an example of how biology can be viewed from
a digital information point of view.
Read through these two articles on whales from our neighbors
at the Smithsonian and at the International Monetary Fund: