Everyone has used or seen a spreadsheet (Excel) before, and perhaps
even written a bit of code in the spreadsheet to update totals.
However, some desirable actions on a spreadsheet are difficult,
but straightforward in a programming language like Python. We'll
examine one such application.
The more interesting application is called item-set
mining, which launched the field of data mining years ago, now
more fashionably called data or business analytics.
It is fundamentally a business problem. We'll write some code
to solve a simple version of the problem using real data.
3.30 Video:
Part A: Tackling a problem that's difficult in Excel
First, let's begin with: what's a spreadsheet?
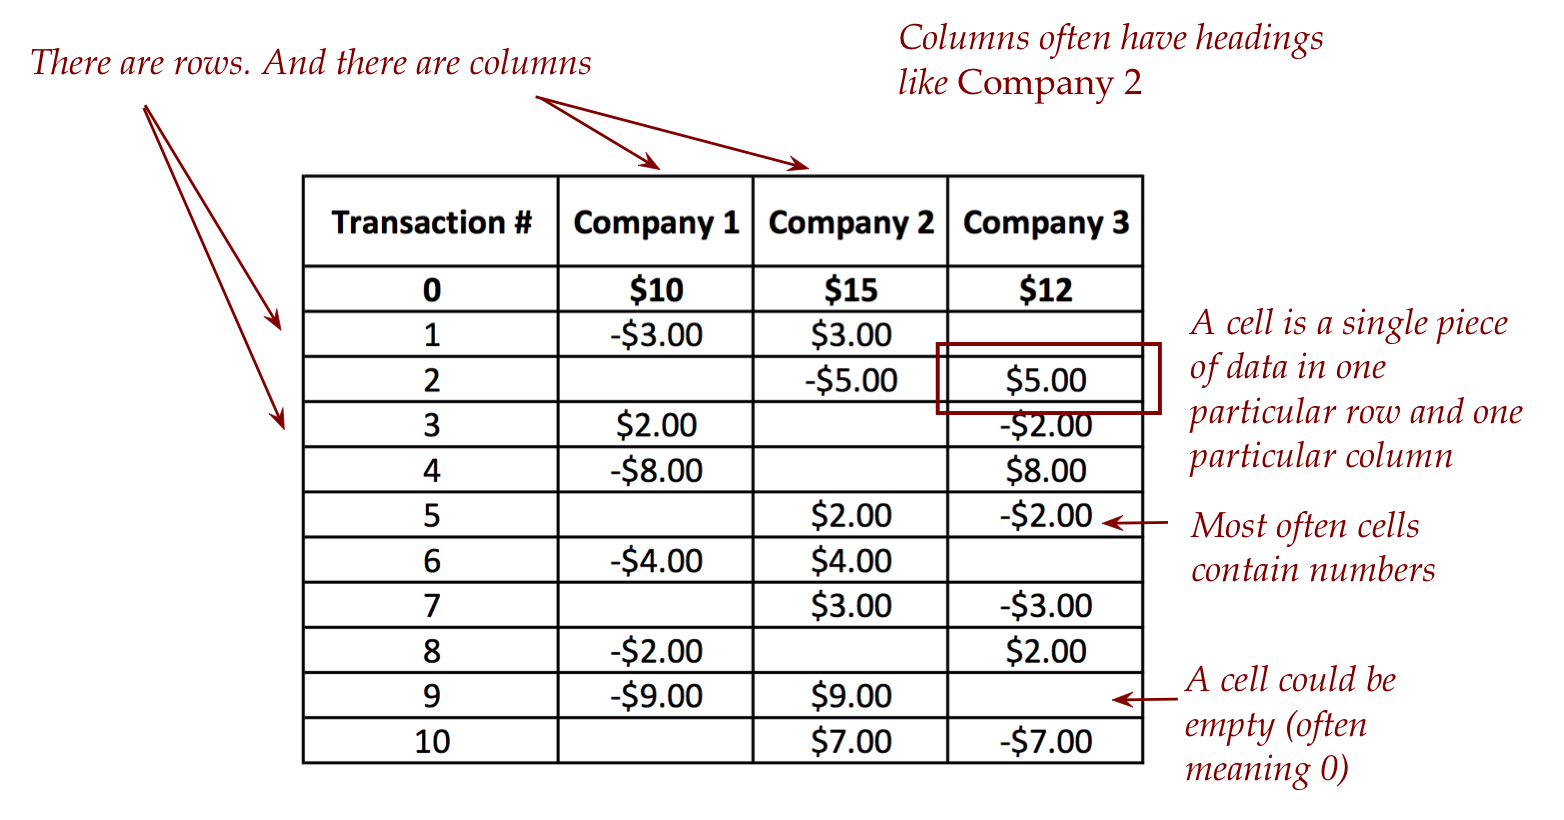
- A spreadsheet is a table, like this:
- But beyond just a table (which you can type in a text document),
spreadsheet software like Excel comes with:
- Features to work with the data (perform aggregates, sort).
- Features to present the data (colors, graphs)
- Here's the Excel version
of the above spreadsheet.
- What does one do with spreadsheets?
- Spreadsheets became popular because businesses need to
track revenue and expenses, and enable forecasting.
- A budget with various items is easily presented in a spreadsheet.
- One kind of use is to store transaction data:
- A monetary interaction with a business is often called a transaction.
- Typically, transactions are ordered by time of occurence
(earliest first).
- The example we've just seen is an example of a list of
transactions that record inter-company payments:
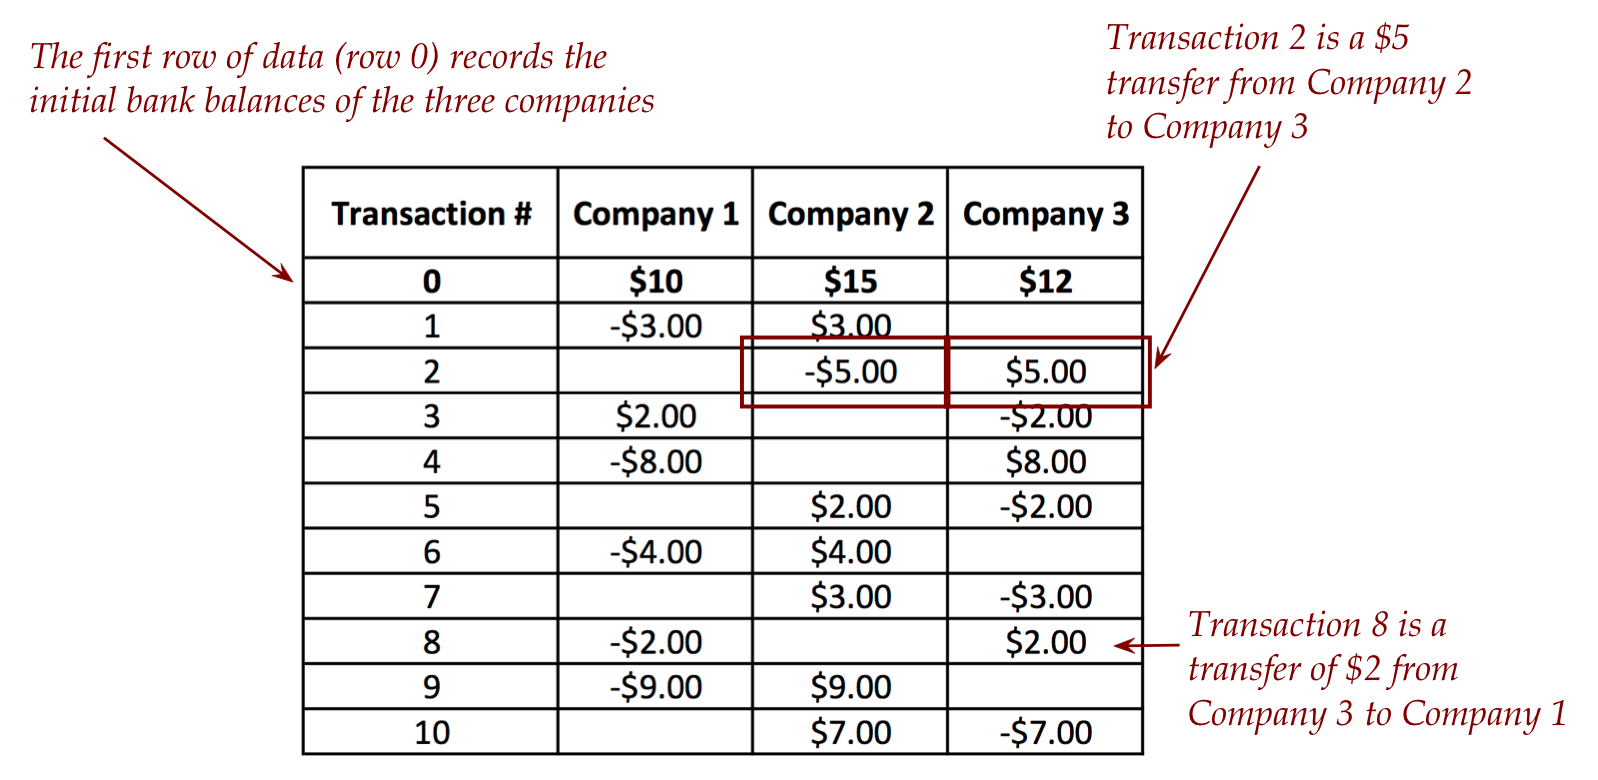
- Think of this as data in the bank that is used to
conduct the transfers for companies that transact frequently.
- As one applies each transaction, every company's balance
changes.
- The bank's (computational) goal: identify when a balance
becomes negative.
- To see this in action, let's compute the changing bank
balances alongside:
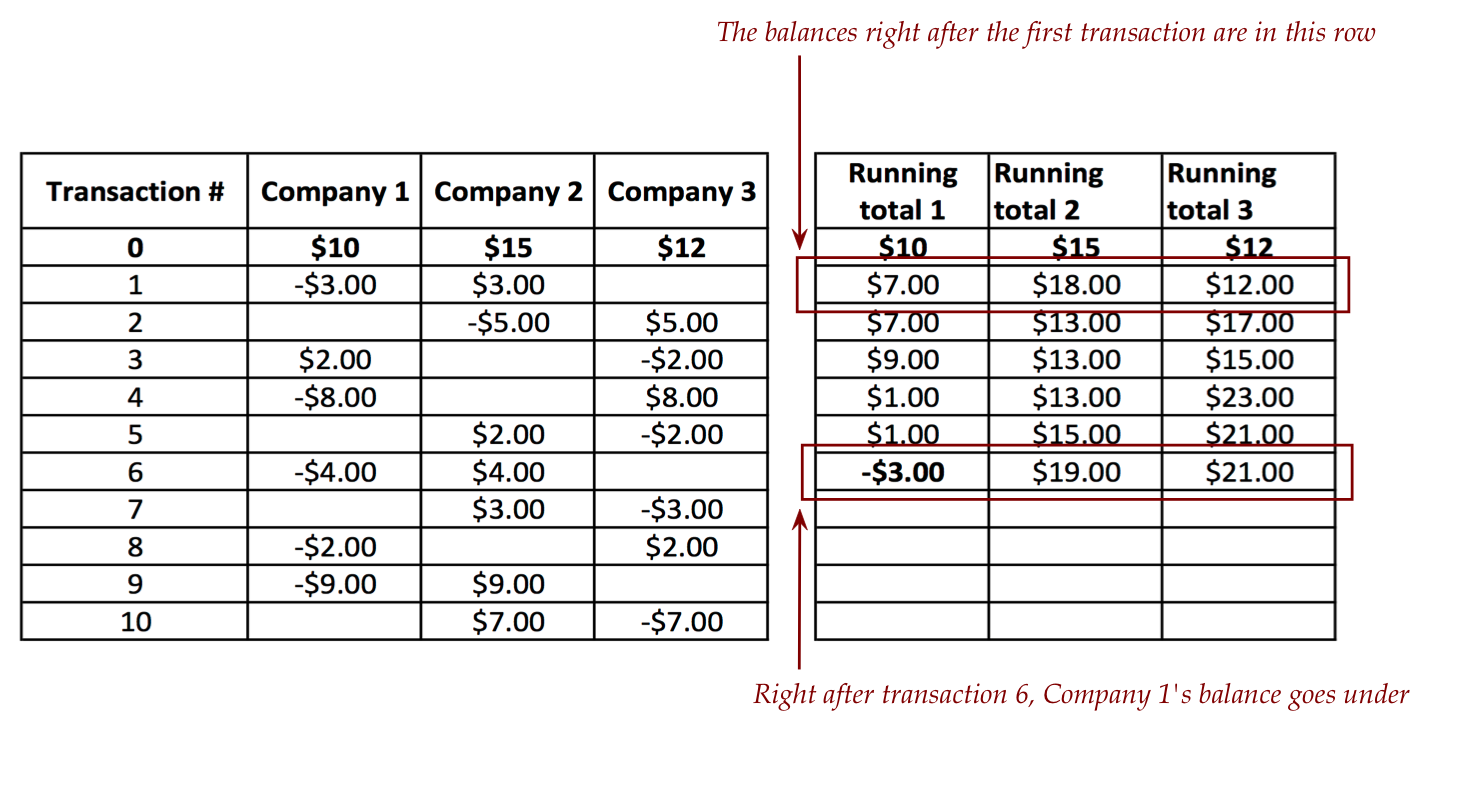
- The challenge is to identify "transaction 6" as the
first transaction that causes an overdraft (causes one balance
to go under).
- This is not simple to implement in Excel but, as we'll see,
reasonably easy in Python.
The key ideas:
- First, how is a spreadsheet stored in a way that a Python
program can read?
- The most common format is the the so-called CSV
(Comma-Separated Values) format:
- For example, the above transaction data in CSV format
(without the column headers, which are strings) looks like this:
0,10.00,15.00,12.00
1,-3.00,3.00,0.00
2,0.00,-5.00,5.00
3,2.00,0.00,-2.00
4,-8.00,0.00,8.00
5,0.00,2.00,-2.00
6,-4.00,4.00,0.00
7,0.00,3.00,-3.00
8,-2.00,0.00,2.00
9,-9.00,9.00,0.00
10,0.00,7.00,-7.00
- As you can see, each row is on one line, with the
contents of each row separated by commas (and spaces removed).
- We'll use a 2D array, say,
data
to store the CSV file:
data[i,j] = ... # j-th element in row i
- Thus, in the example above
print(data[0,1])
print(data[0,2])
print(data[0,3])
will print the initial balances of the three companies.
- So, the goal is to scan row by row, updating
balances until one balance is negative (if that happens).
- The moment that happens, exit print the transaction number
and offending company's (negative) balance.
3.31 Exercise:
Download the following:
trans_analysis.py,
test_trans_analysis.py,
trans_data.csv,
and
trans_data2.csv.
Fill in the needed code in
trans_analysis.py.
and run
test_trans_analysis.py
which has the test code.
3.32 Video:
Part B: Item set mining, the foundational problem in business analytics
Consider the following kind of data:
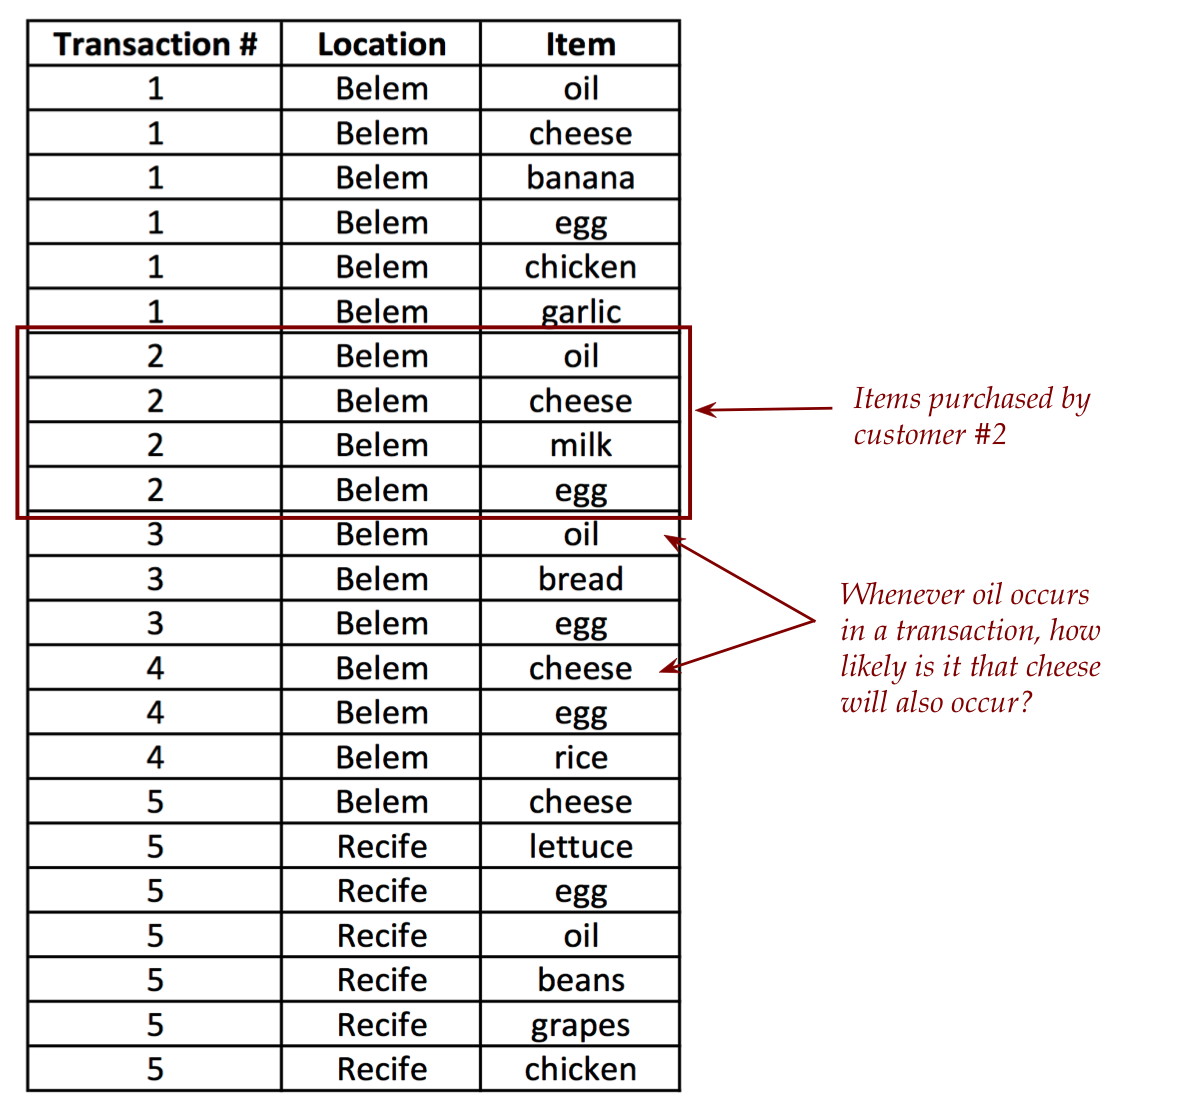
- Suppose the data is from a grocery chain spread across several cities.
- In this case, the figure shows a sample from two Brazilian
cities, Belem and Recife (from which we'll use actual data).
- Each row is a shopping item, grouped by customer.
- Thus, customer #2 purchased: oil, cheese, milk, egg.
- A different way of organizing the same data:
1: {'cheese', 'egg', 'garlic', 'chicken', 'oil', 'banana'}
2: {'cheese', 'oil', 'milk', 'egg'}
3: {'oil', 'egg', 'bread'}
4: {'cheese', 'rice', 'egg'}
5: {'cheese', 'egg', 'beans', 'grapes', 'oil', 'chicken', 'lettuce'}
That is, each customer purchases a set of items.
- This is sometimes called item set data.
- As you can imagine, this kind of data is available for
nearly any kind of business.
The problem of item-set mining asks the question:
what can be learned about purchase patterns from the data
that can then be translated into marketing opportunities?
- For example, if oil and eggs are found to occur together very often,
a number of product-placement strategies are possible.
- For example, a store can place eggs near oil so that no
customer forgets to purchase both.
- Alternatively, the two can be separated so that a walk in the
store from "eggs" to "oil" leads past many impulse-purchase displays.
- Historically, this was one of the earliest "big data"
problems in business, and is also called
market basket analysis
- Note: this subfield is awash with constantly evolving terminology,
for example,
business analytics, data analytics, data mining, business intelligence.
Two common definitions:
- Consider "oil" and "eggs".
- Support: what fraction of transactions contain both
oil and eggs?
- In the above data: 80% (4 out of 5) have both oil and eggs.
- Confidence: of all the transactions that contain
"oil", how many also contain "eggs"?
- In the above data: 100% that contain oil (there are four of
them) also contain eggs.
- Note that confidence is not symmetric: the number of
egg-containing transactions that also contain oil is 80%.
- The same definitions apply to larger item sets.
- For example, given the itemset {oil, eggs} and the
target item {chicken}, one can ask how often all three
occur together (the support) and what fraction
of oil-and-egg containing transactions also contain chicken (confidence)?
- Typically, one looks for both high support and high confidence.
We will focus on computing support since computing confidence
is similar. And we'll do so for pairs of products.
Key ideas:
- The data will be in CSV format. In fact, to simplify, we'll use
three versions of the data:
-
Small:
shopping_data_small.csv,
which has data for 5 transactions (and is pictured above).
-
Medium: shopping_data_medium.csv,
which includes data for 500 transactions.
-
Full: shopping_data_full.csv,
which is the full dataset with 1,538 transactions from a chain
spread across several cities in Brazil.
- The data was obtained from the following paper:
Gonçalves, E. C. (2014). A Human-Centered Approach for Mining Hybrid-Dimensional Association Rules. Proceedings of the 17th International Conference on Information Fusion, (FUSION 2014), Salamanca, Spain.
- We've seen the structure of the data file above: a
transaction number, the location, and product.
- We've written some code to extract the data from a file
and produce the following:
[1, 'Belem', 'oil']
[1, 'Belem', 'cheese']
[1, 'Belem', 'banana']
[1, 'Belem', 'egg']
[1, 'Belem', 'chicken']
[1, 'Belem', 'garlic']
[2, 'Belem', 'oil']
[2, 'Belem', 'cheese']
[2, 'Belem', 'milk']
[2, 'Belem', 'egg']
[3, 'Belem', 'oil']
[3, 'Belem', 'bread']
[3, 'Belem', 'egg']
[4, 'Belem', 'cheese']
[4, 'Belem', 'egg']
[4, 'Belem', 'rice']
[5, 'Belem', 'cheese']
[5, 'Recife', 'lettuce']
[5, 'Recife', 'egg']
[5, 'Recife', 'oil']
[5, 'Recife', 'beans']
[5, 'Recife', 'grapes']
[5, 'Recife', 'chicken']
- From this, let's write some code to merely extract the
list of cities.
- First, begin by reviewing how a set works in Python,
from Module 1.
- Now we'll exploit the set() feature in Python to ensure
that duplicates are first removed before a list is made:
def get_cities(data):
    # Start with a set:
    cities_set = set()
    for row in data:
        # Add to the set, which automatically removes duplicates
        cities_set.add(row[1])
    # Convert to list:
    cities = list(cities_set)
    return cities
- Similarly, one can obtain a complete set of products
(without duplicates).
- We will provide code to create a list of transactions where
every transaction row contains the full list of products, as in:
[1, ['oil', 'cheese', 'banana', 'egg', 'chicken', 'garlic']]
[2, ['oil', 'cheese', 'milk', 'egg']]
[3, ['oil', 'bread', 'egg']]
[4, ['cheese', 'egg', 'rice']]
[5, ['cheese', 'lettuce', 'egg', 'oil', 'beans', 'grapes', 'chicken']]
- This is the data we'll use to compute support:
for every pair of products in the product list,
we'll run through all the transactions and count the number
of transactions where the pair exists.
- So, the desired output is:
['cheese', 'egg', 4]
['egg', 'oil', 4]
['cheese', 'oil', 3]
['cheese', 'chicken', 2]
['chicken', 'egg', 2]
['chicken', 'oil', 2]
['banana', 'cheese', 1]
['banana', 'chicken', 1]
['banana', 'egg', 1]
['banana', 'garlic', 1]
['banana', 'oil', 1]
['bread', 'egg', 1]
['bread', 'oil', 1]
['beans', 'cheese', 1]
['beans', 'chicken', 1]
['beans', 'egg', 1]
['beans', 'grapes', 1]
['beans', 'lettuce', 1]
['beans', 'oil', 1]
['cheese', 'grapes', 1]
['cheese', 'garlic', 1]
['cheese', 'lettuce', 1]
['cheese', 'milk', 1]
['cheese', 'rice', 1]
['chicken', 'grapes', 1]
['chicken', 'garlic', 1]
['chicken', 'lettuce', 1]
['egg', 'grapes', 1]
['egg', 'garlic', 1]
['egg', 'lettuce', 1]
['egg', 'milk', 1]
['egg', 'rice', 1]
['grapes', 'lettuce', 1]
['grapes', 'oil', 1]
['garlic', 'oil', 1]
['lettuce', 'oil', 1]
['milk', 'oil', 1]
- We'll typically be interested in the case where the
occurrence (number of transactions is more than 1).
- So, if we require a minimum of 3, the output will be
['cheese', 'egg', 4]
['egg', 'oil', 4]
['cheese', 'oil', 3]
3.33 Exercise:
Start by downloading
shopping_data_small.csv,
the dataset in the example above.
Then, download
grocery_analytics.py
and
test_grocery_analytics.py.
The latter file has all the tests, which you can run one by one for
each dataset, starting with the first one (5 transactions).
The former file has comments that explain what code
you need to write.
When you run the test, the output should look like this:
results_small.txt.
3.34 Exercise:
Once you got the small set working, you can un-comment the second
'and third tests in turn and use the corresponding
datasets:
shopping_data_medium.csv
and
shopping_data_full.csv.
The output should look like
results_medium.txt
and
results_full.txt,
respectively.
(The full set might take a while to run.)
3.35 Video:
About item-set mining:
- We have scratched the surface of the itemset-mining problem.
- You noticed that the full dataset took considerably longer
to execute than the small one.
- For groups of products, the execution time is even more
significant.
- There are clever algorithmic techniques to reduce the
execution time and the so-called combinatorial explosion
with large data sets and many combinations of products.
Optional further exploration
If you'd like to explore further:
Back to Module 3