- Given an adjacency-list representation of a directed graph, explain how
you would (give high-level pseudocode):
- Compute the out-degrees of all vertices.
- Compute the in-degrees of all vertices.
-
In each of the graph examples below, your graph should have
at least 6 nodes.
- Draw an example of a graph such that if you remove any one edge, the resulting graph remains connected.
- Draw an example of a graph such that if you remove any edge, the resulting graph is not connected.
- Draw an example of a graph such that only one edge in the graph has the property that if you remove it, the resulting graph will not be connected.
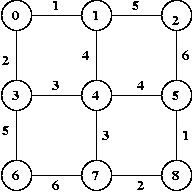
- For the graph below, show the steps in executing Kruskal's
algorithm and Prim's algorithm. Draw the graph with the
MST edges identified at each step.

- Suppose a new degree curriculum is being offered with exactly N courses, all of which are required. Various courses have pre-requisites; a single course can have multiple pre-requisites. The curriculum is properly designed in that you can't go back a pre-requisite chain and loop back to the starting course. Suppose also that a student can take any number of courses in a semester. Describe in pseudocode an algorithm to find the minimum number of semesters needed to graduate? What is the running time of your algorithm?
- Consider a weighted, fully-connected tree as in this example:

Write detailed pseudocode for a recursive algorithm that takes as input a tree with vertices numbered 0 to n-1, a designated node k, and computes the weight of the maximum weight path from k.
- Explain why your code works.
- Use the above example (starting with E) and draw the recursion tree (as we did for mergesort in module 2), making clear how recursion proceeds.
- Analyze the running time in terms of n.
Note: Credit will not be given only for answers - show all your work: your reasoning, steps you took to get your answer etc.
In this part, you will use Kruskal's algorithm (with adjacency matrices) to estimate the minimum-spanning tree weight of a randomly-created set of points. The points will be n random points in the unit square.
- Consider a set of random points in the plane. For example, suppose these were pegs nailed to a board. Suppose you had to connect these pegs with the least amount amount of string. Note that this is just the minimum spanning tree problem. (You need to think about this for a few minutes). The goal is to compute the weight of the minimum spanning tree for a random set of points. Here, you can assume an "edge" between each pair of points with the distance between as the weight.
- How do you generate n random points in the unit square?
And just what is the unit square?
The unit square is the square with one corner at the origin (0,0) and opposite corner at (1,1). To generate a point randomly, we can use UniformRandom.uniform() to generate a value randomly between 0 and 1 for the X value, and call it once again for the Y value. So, to generate n such X and Y values, you can use this code:for (int i=0; i < n; i++) X[i] = UniformRandom.uniform(); for (int i=0; i < n; i++) Y[i] = UniformRandom.uniform(); - Modify the code given to you in Module 8 for Kruskal's algorithm. Read through this carefully.
- Name your class Kruskal.java.
- Your class will need to implement the SpanningTreeAlgorithm interface. In particular, you will need to provide implementations for these methods: initialize(), minimumSpanningTree(double[][] adjMatrix) and getTreeWeight().
- The classes and interfaces involved in this exercise are:
The Algorithm interface
The SpanningTreeAlgorithm interface - Also, Kruskal's algorithm will need an implementation of Union-Find. For this purpose, you should create a class called UnionFindInt. You can intuit what this class needs to have from its use in the Module 8 examples.
- Use the test environment to test your minimum spanning tree algorithm. However, it does not compute the average tree weight. Simply submit your hardcopy and evidence that your code worked for the average-weight problem.
- Use this properties file for testing your adjacency matrix implementation.
- Also submit the output for the following experiments
in your jar file (as PDFs):
- Run your algorithm once with n=10 points. For this particular case, draw by hand the actual points on a unit square (draw the square to be at least 3 inches per side), labeling the points 0, ... n-1, and indicate which edges were in the spanning tree your algorithm computed.
- Plot a graph of the average MST weight vs n (the number of points) for n=10, 20, ..., 100. To get the data point for n=10 points, you should take an average of a 100 MSTs.
Next, use your implementation for the following:
- Suppose we have n random points, and suppose a minimum-spanning tree has already been computed.
- We now want a second MST that does not use any of the edges of the first one.
- Clearly, the second MST is not going to have a weight that is as low as the first MST's weight.
- Your goal is to evaluate "how much worse" (as a percentage
increase) the second MST is over the first one. Do this
by calculating an average over lots of random points. Thus
- For n=10, generate a hundred sets of 10 random points. For each set, compute the two MSTs, and the weight of the second one Compute the average over the 100 sets.
- Repeat for n=20.
- Do this for n=30, .., 100, and plot a graph that will show both MST weights.