PMCP: Peptide Mass Comparison Program
What is it?
PMCP is a program that helps biologists evaluate the output of
mass spectrometry experiments. In particular, if you have data
from control and experiments, and are looking for a simple way
to see a pattern in the distribution of masses, this program
helps visualize the mass spec data.
The purpose of this program is to compare peptide mass data
among three types of data: the masses of (tryptic) peptides from a known
protein, to the masses of a putative match, to masses from the same protein
that has been subjected to some potential modification.
Given a set of text files containing lists of peptide
masses, this data analysis program allows users to compare peptide masses
between known proteins and control and experimental data. In addition to
several textual mass comparisons, it generates graphs that illustrate the
percentage of total files that contain a peptide of the known protein, allowing
the user to observe peptides that are present in control data and significantly
absent in experimental data (peptides whose masses have been modified by
treatment). If the user elects to input a known protein with peptide masses in
the order of the primary sequence, this information is retained in the graph,
allowing the user to observe regions of the protein that are particularly
modified. This information can be used in conjunction with NCBI Cn3D software
to visualize the location of modifications in the structure of the
protein.
PMCP was written by Pria Anand (NSF REU summer student)
and Rahul Simha.
The project was supervised by Profs. Rahul Simha (Computer Science)
and Rob Donaldson (Biology).
This project was partially supported
by a National Science Foundation REU site awarded to GWU
(PI: Rob Donaldson).
Where do I get it and what do I need to run it?
PMCP is written in Java and should execute on any operating
system that supports recent releases of Java. These
include most common Linux, Windows or MAC-OSX PC's.
Download and installation instructions:
- Download pmcp.zip and unzip.
- This will create a directory called pcmp.
- Add this directory to your CLASSPATH variable so that
Java can find it.
- Run the MassSpec class in the directory.
How do I run and use it?
- Generating data.
First, your data. PMCP accepts data generated by the
ExPASy PeptideMass program
(select "chronological order" retain information about the primary sequence
of the protein) in plain text format and copied to a text file. Experimental
data may be generated by mass spectrometry, and a list of peaks may be copied
to a text file.
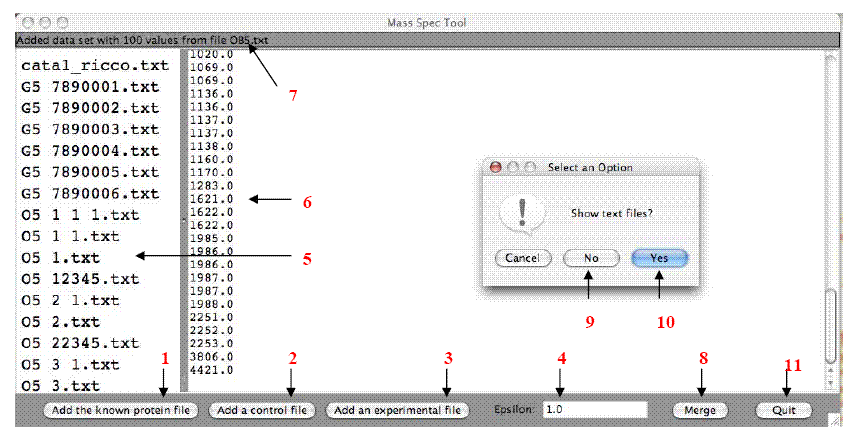
- Data Input into PMCP. (See the figure below)
Files must be saved in text (.txt, not .rtf) format and
inputted in order: Add the known protein first (1), followed by all control
files (2), and finally all experimental files (3). To change the degree to
which peptide masses must match to be counted as identical, enter a number in
the epsilon field (4) -- 1.0 matches peptide masses to the whole number, 0.1 to
the tenths place, etc. As files are added to the program, the file name will
appear in the panel to the left (5), while the text of the current
input file will appear in
the main panel (6). Text at the top of the window monitors the files as they
are added (7). Select "merge" to view the output (8). When prompted for whether
or not you would like to view text files, choose "no" to only view graphs (9)
or "yes" (10) to view all outputs. To quit the entire program, select the
"quit" button at the bottom of the window (11)

- Text Output.
The text outputs are as follows:
- Numerical:
All files are sorted by numerical order in adjacent columns in the same window.
Matching peptide masses appear on the same line.
- Chronological:
The "known" input remains in its original order. For each subsequent file, only
those peptide masses that match a peptide mass in the known protein are
retained in adjacent columns in the same window. Again, matching peptide masses
appear on the same line across columns.
- Non-matching:
One window is created for each file containing only the peptides that appeared
in the experimental data but not the known protein. The non-matching outputs
may be saved as text files and directly read back into the program with another
known protein.
Each window has a "save" button that allows it to be saved
as a separate text file. To change the file name, change the text in the field
at the bottom of the window, making sure to keep the ".txt" postfix. The
default file output location is the directory where the program is saved.
- Graphical Output.
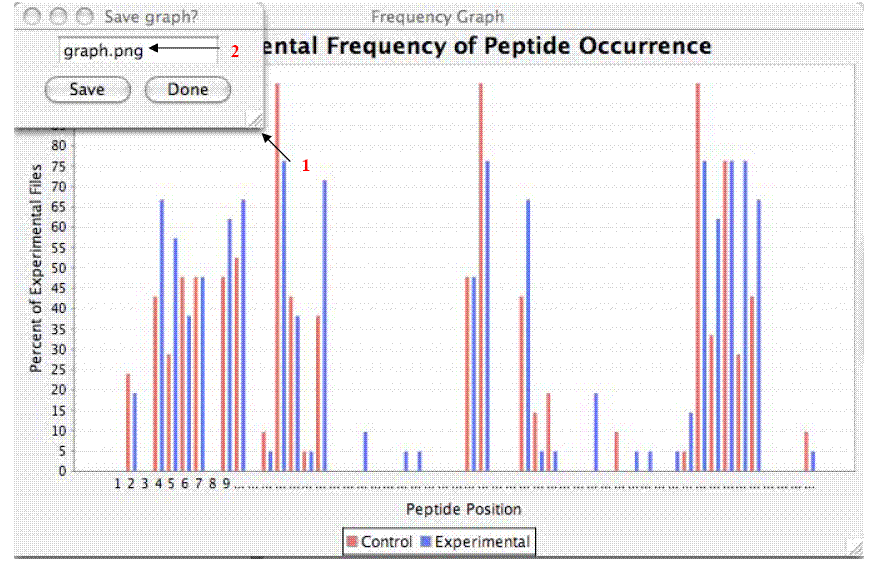
The two graphs produced by PMCP illustrate the following:
- The percentage of total inputted files that contain each peptide of the known
protein, with control and experimental samples appearing side-by-side on the
same axes.
- The difference in this percentage between the control and experimental samples for
each peptide.
The x-axis of each graph assigns a number to each peptide of
the known protein, and retains the order of the peptides in the original file.
The y-axis refers to the percentage of total experimental or control files that
contain each of these peptides. In the original graph, blue bars correspond to
the experimental data, whereas red bars correspond to control data.
Each of the two graphs (See Figure below)
is accompanied by a smaller window (1) that allows it to be saved as
a "png" file. To change the file name, change the
text in the field in the center of this window (2), making sure to keep the
"png" postfix (file type). The default file output location is the
directory where the program is saved.


