Consider these simultaneous linear equations:
$$
\eqb{
x + 3y & = 7.5 \\
4x + 2y & = 10 \\
}
$$
which we can also write as
$$
\eqb{
x_1 + 3x_2 & = 7.5 \\
4x_1 + 2x_2 & = 10 \\
}
$$
In-Class Exercise 2:
Solve these equations by hand using a systematic approach. Describe
your "algorithm" in plain English. Next, verify your solution:
- Enter the equationsDemo directory.
- Copy the plain text file problem1.txt
to equations.txt.
- Execute SolveEquations.
Examine the file problem1.txt and explain how the data
matches the above problem.
Next, consider these equations
$$
\eqb{
x_1 & + 3x_2 & -2x_3 & = 9.5 \\
4x_1 & + 2x_2 & & = 10 \\
2x_1 & - x_2 & + x_3 & = 0
}
$$
In-Class Exercise 3:
Show how your algorithm applies to the above equations.
Verify by using the data in problem2.txt.
(To use the demo on
problem2.txt
copy over
problem2.txt
to
equations.txt,
which is the input file to the program.)
In-Class Exercise 4:
What are the two parameters to the solveEquations() method?
What is returned from the method?
Next, consider the equations
$$
\eqb{
x_1 + 3x_2 & = 7.5 \\
2x_1 + 6x_2 & = 10 \\
}
$$
In-Class Exercise 5:
Show what happens
when your algorithm is applied to these equations. What do you
conclude? Verify by using problem3.txt.
In-Class Exercise 6:
Examine the data in problem4.txt
and write down the corresponding equations. Why does the problem
have multiple solutions?
In-Class Exercise 7:
Examine the data in problem5.txt, write down
the corresponding equations and apply your algorithm.
Do these equations have a solution? What do you see
when you run the demo?
Compare the equations to the first data set (in
problem1.txt).
In-Class Exercise 8:
Run the demo on the data in problem6.txt.
Write down, then compare these equations to the equations in problem5.txt.
What is dissatifying about the demo's output?
In-Class Exercise 9:
What are desirable features in a general-purpose solver for
simultaneous linear equations?
Some unanswered questions so far:
- Is it always possible to tell whether a particular set
of equations has a solution?
- What is common to problems that have a solution, or that
don't have a solution?
- Are approximate solutions possible when there isn't a solution?
- Does the solution method depend on the number of variables? The
number of equations?
Any others?
1.2
Application #2: Gauss' discovery
Carl Friedrich Gauss, considered one of the greatest mathematicians of
all time, developed a method for predicting orbits based on observations:
- Ceres ("say rees")
is the largest known minor planet in the asteroid belt.
- Discovered by astronomers in 1801.
- Difficult to track, owing to Sun's glare, except for a few observations.
- Thought to be impossible to predict at the time.
- Gauss, at age 24, developed a method and correctly predicted
the orbit.
- The method had two parts, both remarkable: (1) Solving some
astronomy problems; (2) figuring out how to use "too many equations"
for the best approximation.
- The latter led to the linear algbera method of least squares.
In-Class Exercise 10:
In the curveFittingDemo, compile and
execute CurveFittingDemo.java. Then, try each of the
four examples in turn as directed in main().
Read the code in the ellipse() method.
- How many parameters does an ellipse have?
- What is the minimum number of data points needed?
Note: the original (true) curve is plotted in red, whereas the
fitted curve is the blue one.
At this point, several questions arise:
- What is the relationship between data points and what linear
algebra needs?
- Does accuracy always increase with more data points?
- Does the method always produce some result or approximation?
- Amongst all approximate solutions, how does the linear
algebra solution fare?
- If an exact solution is possible, does the approach produce it?
1.3
Application #3: A car designer's dilemma
Any graphical design tool needs to allow designers to draw curves
and then to store them.
Three options:
- Approximate with many straight lines.
- Find a mathematical equation to represent each curve of interest.
- Bezier (or similar) curves.
In-Class Exercise 11:
What are comparative advantages and disadvantages of A and B above?
In-Class Exercise 12:
Run the BezierDemo. Draw an interesting curve with four
or more control points. What are the storage requirements for
such a curve using a traditional (type A) approach? What are the
storage requirements using the Bezier approach?
Read the code. What are the inputs to linear algebra?
About Bezier curves:
- Originate in Bernstein polynomials (which we will also visit)
from early 1900's.
- Developed as a curve-representation approach by Pierre Bezier
(at Renault) and Paul de Casteljau (at Citroen).
- They have useful computational and numerical properties.
- Generalize to surfaces.
- Bezier curves or surfaces, and their variations, are now the standard
in any kind of graphical design, fonts etc.
Questions at this time:
- How exactly does it work? What are the limitations?
- What is the computational cost?
- What does it have to do with linear algebra?
1.4
Application #4: 3D to 2D
Our viewing devices are all 2D. Which makes it a challenge
to represent a 3D object.
In-Class Exercise 13:
Consider a cuboid with corners at these coordinates:
(5,1,8), (5,3,8), (9,3,8), (9,1,8)
(5,1,11), (5,3,11), (9,3,11), (9,1,11).
On a sheet of paper, draw x,y,z axes with the z axis going up, the x axis
going roughly south-west, and the y axis southeast. Then draw the cube.
Now consider the left edge of the paper as the y-axis of a 2D plane;
the lower edge of the paper is the z-axis. What are the coordinates
of the cuboid's corners in this 2D world?
In-Class Exercise 14:
Run the Coordinates demo in coordinatesDemo
directory. Then examine the code. Why is the eye position necessary?
In general, linear algebra provides a systematic approach to
many standard geometric transformations:
- Transformations within a coordinate system: rotations,
reflections, translations.
- Transformations between coordinate systems: 3D to 2D,
camera-to-realworld, perspective.
1.5
Application #5: less is more
The goal of nearly every media format is to compress the raw
data into something smaller.
There are fundamentally two types of compression:
- Lossless compression which does not lose any information
when "un-compressed" and tries to exploit redundancy.
- Lossy compression which stands to gain in compression
by accepting some non-human-detectable loss.
Let's look at image compression.
In-Class Exercise 15:
Examine the simple image testimage.png in the compressionDemo
directory. Now study the code in ImageExample.java, then
compile and execute.
- What is the size (total number of pixels) of the image?
- What is the size of the png file?
- Is this an example of lossless or lossy compression?
Linear algebra turns out to play a key role in lossy compression.
Let's take a look at an example.
In-Class Exercise 16:
Try out the three demos in CompressionDemo.java one by one.
(The first one is a one-dimensional image: a 1D array).
In each case, compare the un-compressed image with the original
to get a sense of how "lossy" the compression was.
1.6
Application #6: who is this person?
In the face recognition problem:
- We have a database of face images (photos).
- For a given query image (another face), we wish to find
the "closest" face in the database.
This is merely a special case of the more general image
search problem: find the closest image to given a query image
in a database of images.
In-Class Exercise 17:
Enter the eigenImageSearchDemo directory and
examine the example images in trainingImages, and then
the query images in queryImages. What are the closest images
to the query images?
In-Class Exercise 18:
Run the ImageSearchDemo.
Compare the images found by the eigen algorithm with the images
you found earlier. Now examine the images in the eigenImages
directory. What do you notice?
Examine the code. How is a query image transformed before providing
it as input to linear algebra?
1.7
Application #7: genesis of a search engine
Consider a hyperlink graph:
- Each node is a webpage.
- If webpage A links to webpage B, the graph has a directed
edge from A to B.
Now consider the page importance problem:
- Among all the webpages that satisfy a certain search criterion,
how to list them in order of importance or usefulness?
The general principle: a webpage that other webpages link to
must be important.
In-Class Exercise 19:
Suppose a webpage's importance is defined as the number of
incoming edges in the hyperlink graph. Describe some
advantages and disadvantages of this approach.
Consider instead a random walk approach:
- Imagine a surfer following hyperlinks randomly, and for a
very long time.
- A webpage's importance is defined as the fraction of visits
the surfer makes to that page.
⇒ the probability a surfer visits a node
In-Class Exercise 20:
In the pageRankDemo directory, copy the
file network1.txt to network.txt.
- Draw the network by hand. Which node has the most incoming edges?
- Run PageRankDemo.
Click "start", and then "next" several times to see where
the random surfer goes (yellow). The amount of red in a node
is the visit fraction (an estimate of the visit probability).
- Click "fast-run" and let it run for a minute, then "stop".
- Examine the node visit probabilities (by estimate, and calculation).
Which node has the highest visit probability?
In-Class Exercise 21:
Copy the file network2.txt to network.txt.
- Draw the network. In what way is it fundamentally different
from network1?
- Click "start" and then "fast-run" for a minute, then "stop".
What do you observe?
- Next, "googolize", then "start, fast-run etc". What do you
observe? (We'll ignore the \(alpha\) parameter for now,
and explain that later.) What does "googolize" do?
In-Class Exercise 22:
Examine the code. Where in the code does there appear to be
linear algebra at work?
1.8
Application #8: is this text relevant?
The next step in search, beyond mere keyword-matching, is
to find relevant text that matches the topic of interest
⇒ webpages whose text matches the topic of the search text.
In-Class Exercise 23:
Provide an example of two chunks of text with the same
topic but where a simple keyword match might not work to
identify them as similar.
In-Class Exercise 24:
Examine the files
in wikinews/trainingText in
the
latentSADemo directory
and group
them into topics. Create by hand a 7 x 7 table, and in
table cell (i,j), write down what you think is the correlation
(a number between -1 and 1) in topic between text i and text j.
In-Class Exercise 25:
Run the LSA demo and compare your correlations with
the "before" and "after" correlations found by the demo.
What are "stop words" and why do we remove them?
Read through the code to see where linear algebra is used.
1.9
Application #9: if you liked that movie, try this one
The goal of a movie recommendation engine is to examine
user ratings of movies and to make recommendations that
accommodate individual preferences as revealed by the ratings.
For example:
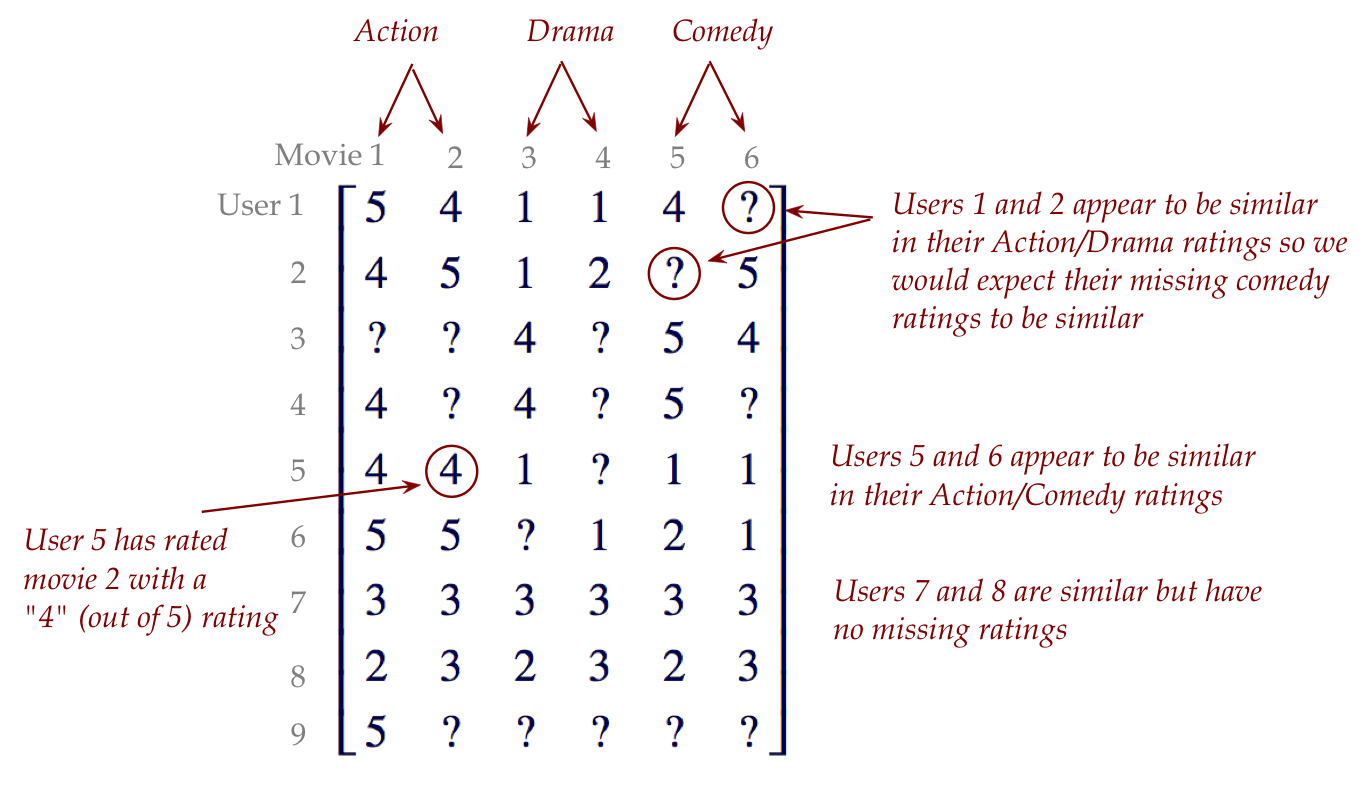
Here:
- There are M users and N movies in a table of ratings.
- Users are rows, movies are columns.
- Every movie rating is a number between 1 and 5.
- Unknown ratings are represented by ?
- We would like to predict these entries as part of developing a
recommendation engine ("if you like X, we think you'll like Y"),
by using the predicted missing entries.
- In real world data, the ratings matrix is typically
very sparse (most entries are missing).
In-Class Exercise 26:
In the collabFilteringDemo, examine the file ratings.txt
with 9 users and 6 movies.
- What fraction of ratings are unknown?
- Which movie is most popular?
- What would go wrong if we merely sorted movies by their average
rating and offered those as recommendations?
- Can you identify users who are similar to each other in their
ratings?
In-Class Exercise 27:
Run CollabFilteringDemo and examine the predicted ratings.
Read the code. What is the input and output when linear algebra is used to
predict ratings?
1.10
Application #10: more bass, less treble
Signal processing is the engineering discipline devoted
to detecting and processing electrical signals of all kinds,
especially audio.
A type of audio processing we're all familiar with: adjusting
bass or treble.
The Discrete Fourier Transform (DFT) is a key technique used
in many signal processing applications.
And linear algebra provides the theoretical foundation for the DFT.
Let's see how decreasing the "treble" content (a high note)
changes the sound.
In-Class Exercise 28:
Enter the signalProcDemo, compile and execute DFT_Demo.java.
Then, comment out playUnFiltered(),
compile playFiltered,
and execute.
1.11
Why study linear algebra?
Here's why:
- The language of linear algebra (matrices, vectors) is widely
used and assumed:
- Used without explanation in other theoretical work.
- Sometimes the use is simple, such as matrix inversion.
⇒
it's just assumed that you know the notation and meaning.
- Linear algebra's applications stand on their own, as we've seen.
- Linear algebra is a constructive theory
⇒
Most (but not all) results result in a useful algorithm
- Linear algebra is a great yet accessible example of a
one-course math theory:
- It develops in digestible pieces.
- The proofs need very little background
⇒
High-school math
- It has both small, easy results, as well as deeper, beautiful
results.
- You can see how meta-level questions about a theory arise.
For example:
- Basic question: how does one invert a matrix?
- Higher-level theoretical question: what types of matrices
have inverses?
- Even more high-level: if a matrix doesn't have an
inverse, is there a next-best thing to an inverse?
- Linear algebra can be learned both symbolically (the usual
math way) and computationally
⇒
writing code that "does linear algebra" is a fun way to learn
In-Class Exercise 29:
Use a search to see how many PDF documents have the word "matrix".
How many of these are scientific publications?
1.11
Sizes of problems
In practice, many of the applications above feature
large amounts of data.
Consider this simple and common example:
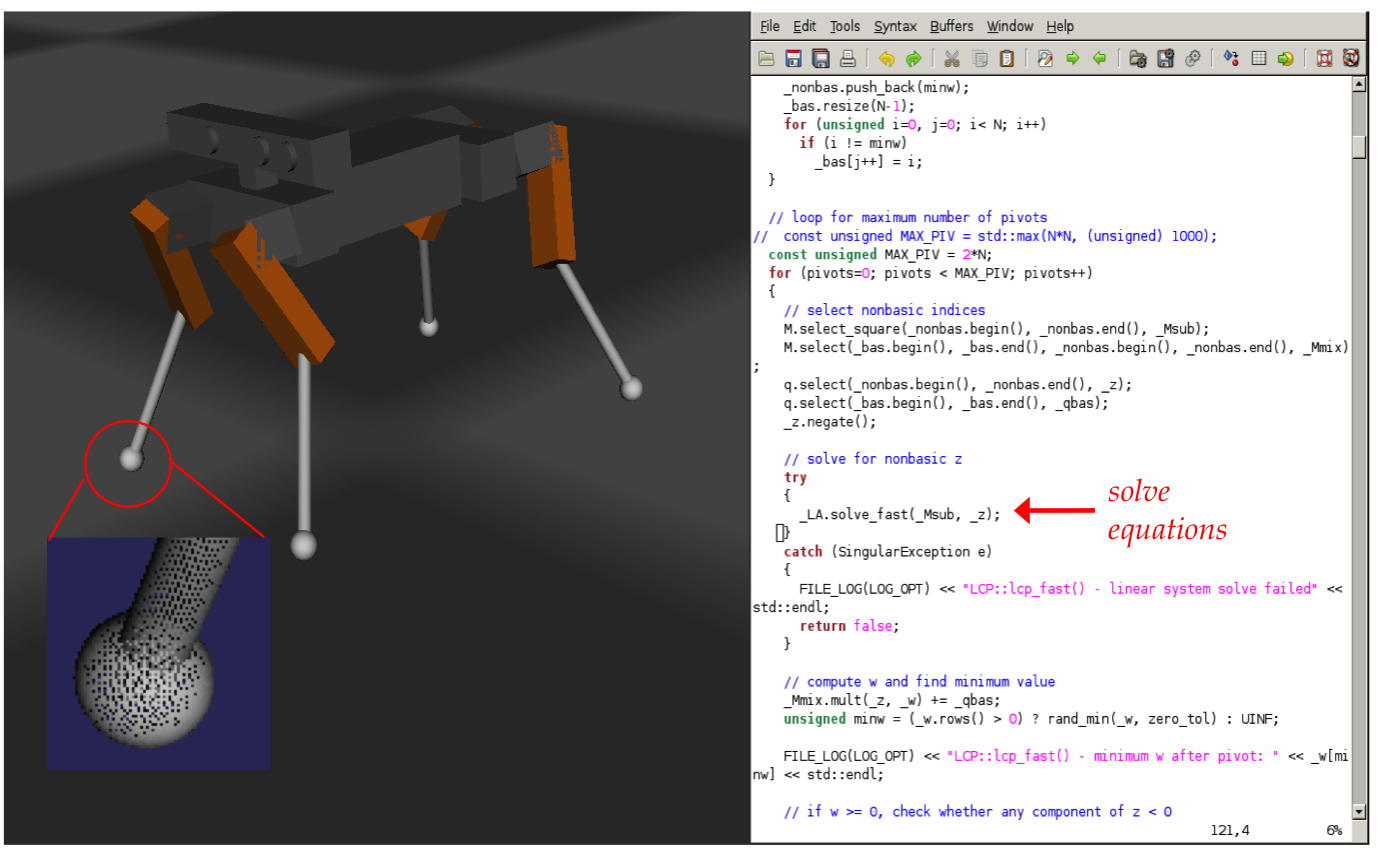
- This is a graphics/robotics application where:
- A 3D object's surface (here, a legged robot) is modeled by
thousands of polygons.
- When objects interact, the application needs to compute
points of contact and interaction forces.
- The computation needs to be quick to simulate real time.
- A key part of computing forces and motion involves solving
simultaneous equations in many variables.
- In the above example: approximately 500 variables in
500 equations every 10 milliseconds.
\(\rhd\)
Here's the data
Larger examples:
- The movie ratings data set released by Netflix had a 100 million
ratings from about half-million users.
- Google routinely computes page rankings for more than a billion
webpages.
1.12
The landscape of linear algebra
There are broadly three bodies of work in linear algebra:
- Basic linear algebra. Core concepts of vectors and
matrices, orthogonality, eigenvalues and SVD.
⇒
This course.
- Numerical linear algebra. How to perform key computations
(matrix inverse, eigenvalues, SVD) accurately and fast,
especially for large data sets
- This is generally quite difficult.
⇒
Even someone like Von Neumann admitted being challenged.
- It's a specialization by itself.
- It took 50+ years to develop robust matrix inversion.
- Advanced theory. This is of purely mathematical
interest, mostly theory for theory's sake.
1.13
The architecture of linear algebra
In a nutshell:
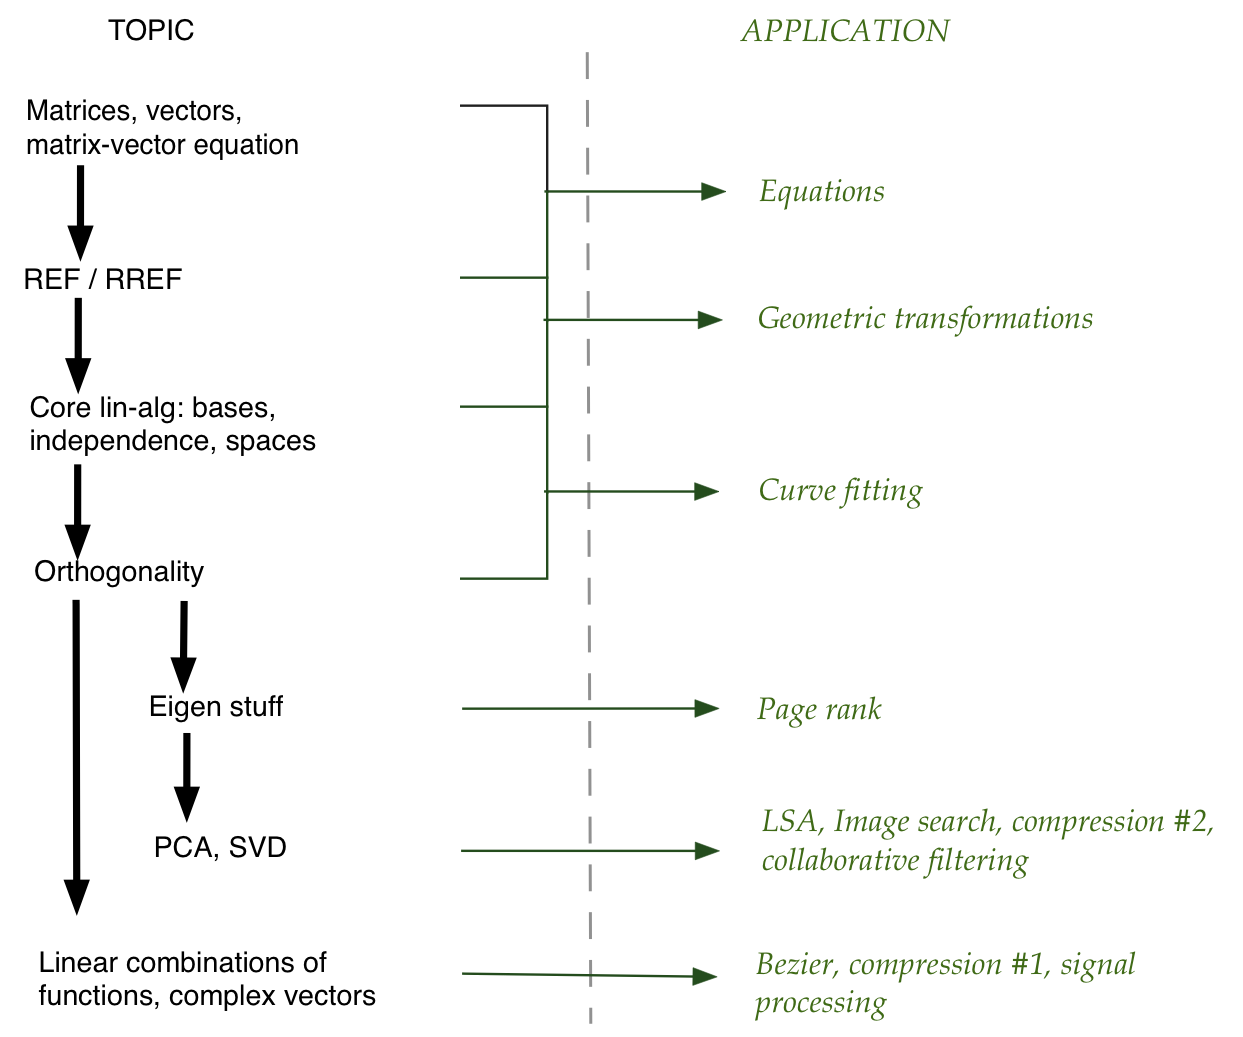
Linear algebra will feature two recurring themes.
The first one: linear combinations:
- Suppose \(a_1, a_2, \ldots, a_n\) are real numbers.
- Consider this expression:
$$
a_1 \boxed{\color{white}{\text{LyL}}}_1
+ a_2 \boxed{\color{white}{\text{LyL}}}_2
+ \ldots
+ a_n \boxed{\color{white}{\text{LyL}}}_n
$$
- For example:
$$
0.7 \boxed{\color{white}{\text{LyL}}}_1
+ 4.23 \boxed{\color{white}{\text{LyL}}}_2
- 6.18 \boxed{\color{white}{\text{LyL}}}_3
+ 0.0003 \boxed{\color{white}{\text{LyL}}}_4
$$
- Here, we are taking a weighted combination of \(n\) things.
⇒ This is a linear combination.
- Linear algebra is really about such linear combinations.
- Sometimes the boxes contain numbers.
- At other times, they contain other mathematical objects:
vectors, complex numbers, functions.
What is astonishing is that such a simple operation has so many
applications and a rich theory.
The second one: linear transformations:
- Think of a transformation as a function that takes
a mathematical object and produces another (perhaps of the same type):
$$
T \left( \boxed{\color{white}{\text{LyL}}} \right)
=
\boxed{\color{white}{\text{LyL}}}\; '
$$
- What if the transformation had this property:
$$
T \left( \alpha\; \boxed{\color{white}{\text{LyL}}} \right)
=
\alpha\; T \left( \boxed{\color{white}{\text{LyL}}} \right)
$$
- This is one notion of linearity.
- More generally, a transformation is considered linear if
$$
T \left(
\alpha\; \boxed{\color{white}{\text{LyL}}}_1
+
\beta\; \boxed{\color{white}{\text{LyL}}}_2
\right)
=
\alpha\; T \left( \boxed{\color{white}{\text{LyL}}}_1 \right)
+
\beta\; T \left( \boxed{\color{white}{\text{LyL}}}_2 \right)
$$
The idea of a linear transformation will turn out to be an important
abstraction for the theory in linear algebra.
(Although, for practical applications, we won't need to use the idea.)
1.14
Goals of this course
By the end of this course, you should:
- Be comfortable with the language of linear algebra
⇒ basic concepts, the standard notation
- Get immersed in the core ideas and concepts of basic linear algebra
⇒ left alone on a deserted island, you should be able to reconstruct
the theory
- Develop an intuition for the main ideas.
- Even though proofs are short, linear algebra is not necessarily
intuitive.
- Combining the symbolic with the computational should
strengthen intuition.
- Grapple with the proofs of the main results.
- Understand exactly how the core concepts are used in the
above applications.
- Understand the architecture of linear algebra: how
the different "chapters" fit together.
- Be able to, 10 years from now, recognize linear algebra
when you see it, and be able to review it easily.
- Fall in love.
⇒ With the beauty of linear algebra, that is.
1.15
The ultimate payoff: QM and QC,
the two killer apps of linear algebra
QM = Quantum Mechanics
- Quantum mechanics is the theory of light and matter at the microscopic level.
- Both light and matter have strange, probabilistic properties that cannot be explained by conventional (Newtonian) physics.
- Enter QM, based on the linear algebra of complex vectors.
- QM has been spectacularly successful in mathematically explaining (and predicting) the properties of light, matter, and their interactions all the way down to the zoo of sub-atomic particles (like quarks).
- Some of the linear algebraic elements:
- The state of an entity (like an electron) is described by a complex vector.
- The coefficients in the linear combination relate to probabilities.
- Observations are defined by special kinds of matrices
- When observed, the resulting state is an eigenvector of the observation matrix.
QC = Quantum Computing
- Quantum computing is about using microscopic hardware that
exploits the strange quantum properties of light and matter.
- Instead of regular bits, one builds qubits, whose values can go beyond 0 and 1 to any linear combination.
- By cleverly arranging for interactions between qubits, one can compute.
- One surprising application: integers can be factored fast enough to break conventional cryptography.
- A related application: one can use 'flying qubits' to implement
cryptographically unbreakable communication.
- Other fascinating features of QC: quantum teleportation, quantum search that's faster than conventional search.
- All of QC is based on linear algebra:
- Qubits are complex vectors.
- Operations on qubits are (unitary) matrices.
- Observations of qubits are (Hermitian) matrices.
- Results of observations are eigenvectors of observation matrices.
- Coming soon ... a course on QC.