Our main goal here is to work with images. They happen to be brain
images.
Image processing, whether of biological, metereological, or just
regular photos, is a rich area of algorithms. We will scratch the
surface of this fascinating subfield by looking at some simple
examples.
The brain is estimated to have about 80 billion cells called neurons.
When the brain does something (a particular task), some of these
neurons "activate" electrically.
Because electrical measurement is invasive (needs surgery to
implant electrodes), neuroscientists prefer to use non-invasive
imaging to see what they can learn.
When a region of the brain is active while a brain task is
being performed, the theory is that neurons in that region deplete
energy and therefore high-oxygen blood flows into that region soon
after the neural (electrical) activity.
fMRI is an imaging apparatus that can detect the flow of
oxygen-rich blood.
Typically, a subject lies still while given a task. The fMRI
machine performs its scan during this time.
What is the output from an fMRI scan?
This part is a little harder to grasp at first.
Let's start by recalling a standard x-ray image:
Typically, a lung x-ray is taken from front and there is
one image from a single point-of-view.
One could take an x-ray from a subject's side but this
is typically not informative, and so we don't experience it.
Likewise, theoretically, one could get an x-ray looking down
from above the head, but that too is rare.
Because the brain is round, it's useful to capture images
from three vantage points:
Axial: from above the head looking down.
Coronal: from the front as if you were facing the subject.
Sagittal: from the side, where you see the
proverbial "bean" shaped brain.
But there's more to it:
With an x-ray, you walk away with a single image.
But with fMRI, one typically gets many images from one viewpoint.
Each image is at a different depth from the viewpoint.
Think of each such image as a snapshot of a difference "slice".
A full scan will have multiple slices for each of the three
points of view, all put together into a single "zip like" file,
called an nii file.
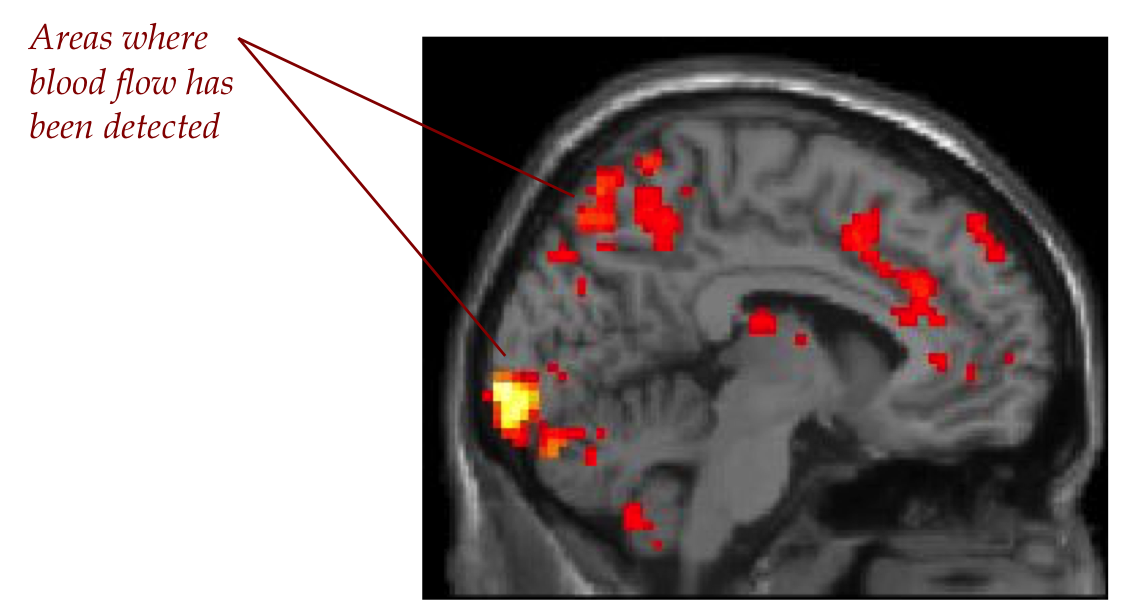
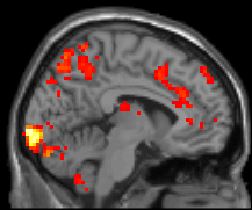
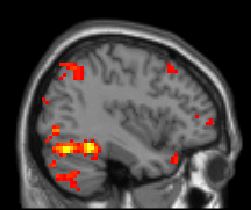
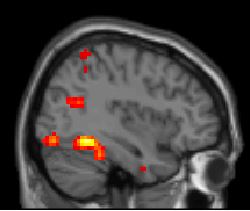
Here is a sample sagittal (side view) slice:
A single scan will have many such sagittal image-slices,
taken at different depths away from the point of view. Thus, for the
above subject, the first sagittal slice began near the right ear,
and the last one near the left ear. The one above is somewhere in
the middle.
The combination of the fMRI scanning device and its software
produces an image like the one above:
Regions with high-oxygen blood are colored.
The rest is in shades of grey.
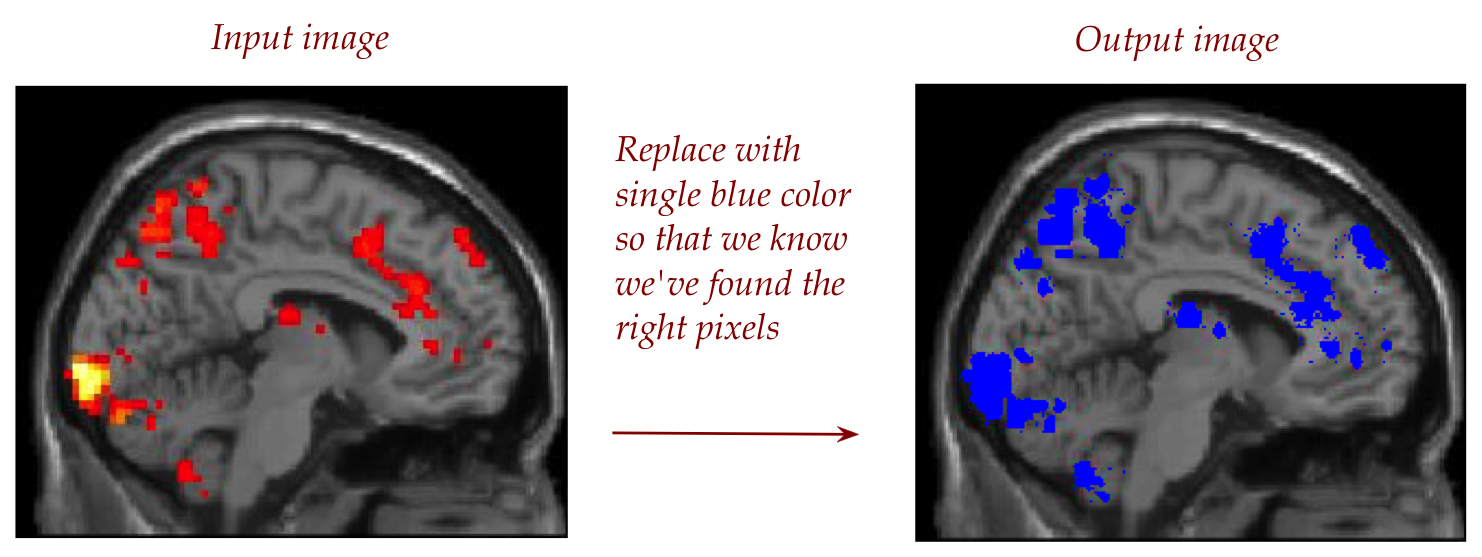
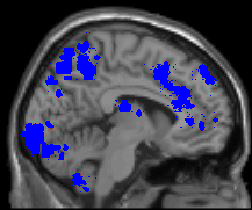
As a first step, let's scan the pixels to identify the non-grey
pixels:
This is what we'd like to do:
The problem is, the grey pixels are grey-ish, meaning
that the red, green and blue values for what looks grey aren't
exactly equal.
Let's use the following approach to determining
whether a pixel is "approximately grey":
Let d be a number that describes how approximate.
If d is 0, then we want all three to be exactly the same.
A higher value of d allows more difference amongst R, G, B.
What we'll do is compute the average of R, G, B and
require that each of R, G and B be "within d of the average".
Let's write this out in pseudocode:
   Let a be the average of R, G, B values for a (color) pixel
   Let d be the tolerance
   Check that for a pixel to be classified as grey:
     1.  |R - a| < d
     2.  |G - a| < d
     3.  |B - a| < d
3.41 Exercise:
Download
neuro1.py
and
drawtool.py.
Also download these two test images:
greytest.jpg
and
task1-subject1-sagittal.jpg.
Then, fill in the missing code as directed in the functions
inside
neuro1.py,
and try each test image in turn. The output you should get
for counting the number of nongrey pixels is indicated in
the comments. What you should see in each case when
the blue version is depicted should look
like
this
and
this.
Use CMD+ (Mac) or Control+ (Win) to make the view larger (because
the former is small).
3.42 Audio:
Part B:
For this next part, we'll aim to get a bit closer to a neuroscience
experiment.
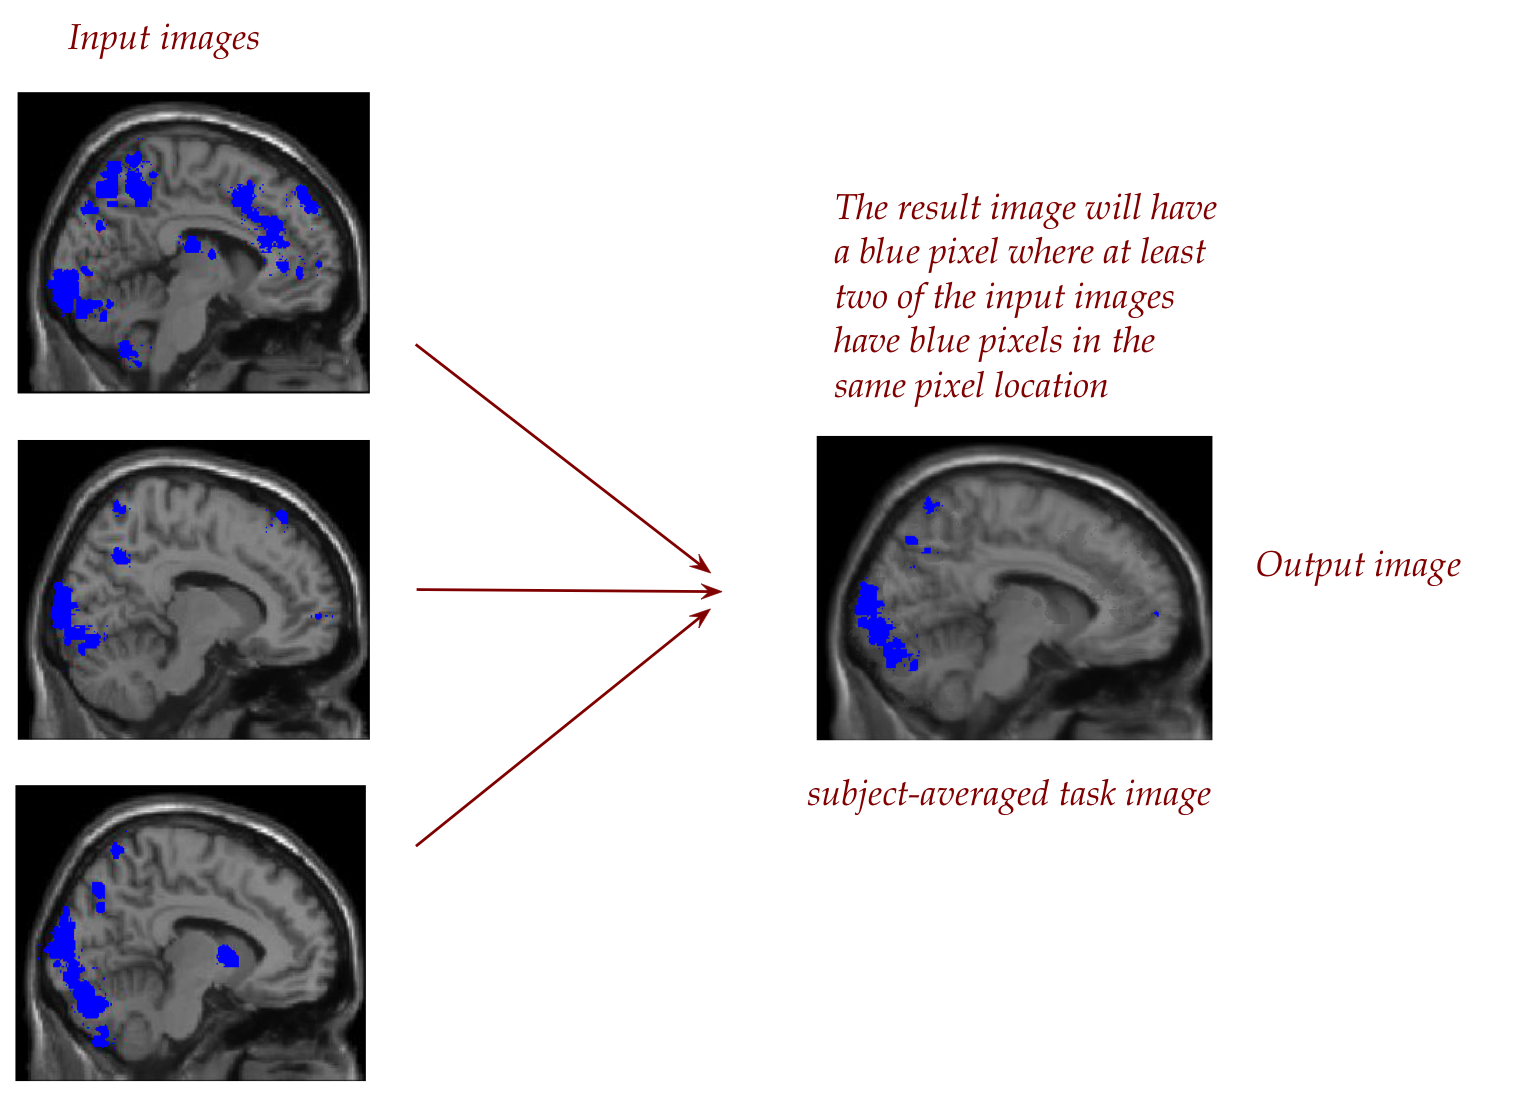
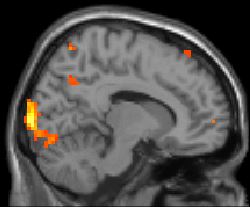
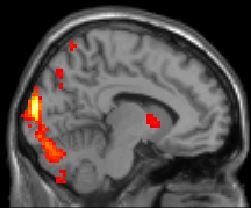
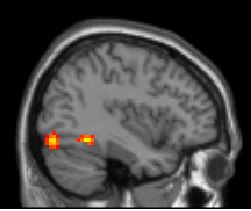
These are six actual samples from a scan on three different individuals
each asked to perform two tasks (separately).
Our goal: understand whether the degree to which the two tasks
require processing in different parts of the brain.
We'll go about this in two steps:
First, for each task, we'll try to identify the common "active"
(blue) areas.
Since we have three subjects, we'll create a single
composite image with a blue pixel wherever at least two of the
subjects have a blue pixel.
Then, the hope is that the common blue represents the region
of the brain (at least in this sagittal slice) used for this task.
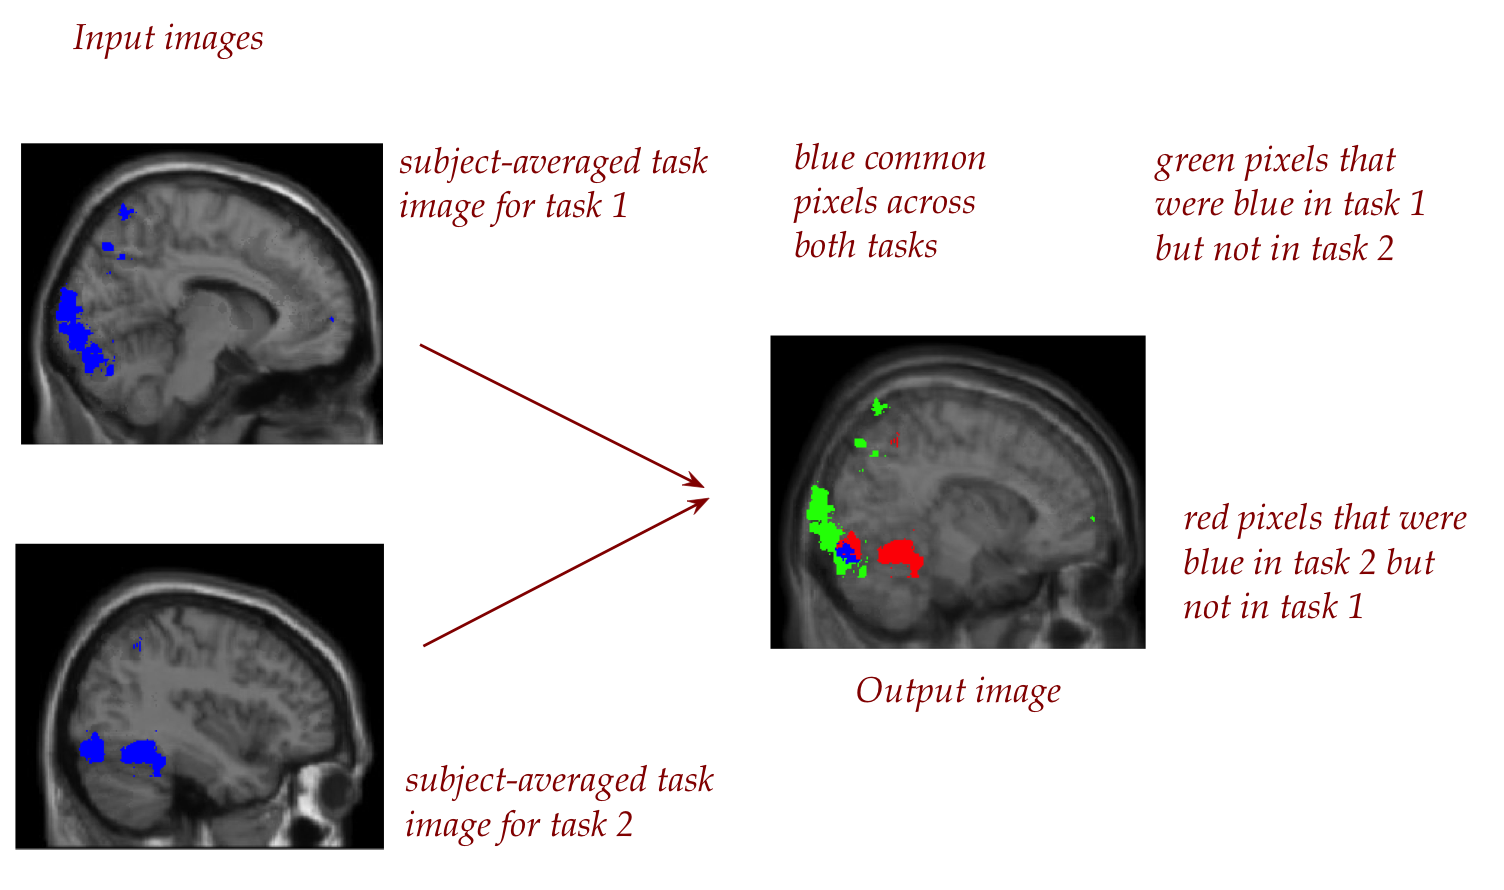
Then, we'll take the two subject-averaged task images and strike up
a contrast.
The idea is to use a single image to show where the two tasks
have "active" areas in common and where they are different.
We could call this the final task-contrast image.
If most of the active areas area different, one could
interpret that as different brain regions for the two tasks.
So, now, the programming goal is clear:
Write code to task three (subjects for one task) images and
create a new image where there's a blue pixel if at least two
of the three input images have a blue pixel in the same location.
Write code to take two subject-averaged images from the above
and create the multi-colored task-contrast image.
Issues when comparing images:
One issue is: what if they are not the same size?
In this case, the six data images have slightly different sizes.
The solution approach we will take is to pick the minimum
number of rows, and minimum number of columns.
Another issue is: what if the images are not aligned?
That is, what if the pixel at location [3,4] in one image
is a really different part of the brain than the same [3,4] pixel
in the other image?
To fully solve this problem, the content in each image has
to be aligned.
This is a fairly difficult problem, sometimes called
the registration problem. We will not address it here
and instead assume the images are well-aligned.
And of course, different subjects have different brains,
so how should one align two of them for the sake of comparison?
For our "region identification" problem, a small error
in alignment will not be a significant issue.
3.43 Exercise:
Download and edit
neuro2.py,
which contains instructions in comments, and describes
some expected output. Write up the results in your module pdf,
along with screenshots of the resulting contrast image.
How many rows and columns are in the final contrast image?
3.44 Audio:
About the data:
The six fMRI images we showed above were from the
Algonauts project at MIT.
The two tasks were: (1) to recognize an object; (2) to
recognize an object and a scene.
The full dataset has many more subjects, many tests,
and, of course, all the slices.
The research group has invited you to view a
3D rendering
of brain activity based on their findings, as an example
of how such datasets can be explored.
Try out a tool
like ITK-snap
that's designed to work with medical images. Download sample
nii-format fMRI images and play with it to see how such tools help.
But more fundamentally, there is a serious time lag between
electrical activity (fractions of a second) and blood flow (in seconds),
and it's not clear that particular regions can be described as
responsible for a particular task.
The world of medical imaging has come a long way since the
early days of x-rays, and new techniques continue to be developed.
Which means the algorithmic image processing of such
technologies will always be in demand. And it's interesting.
The subfield of algorithms for images is itself a rich field
with many challenges and algorithms. We've mentioned just one: image
registration. There are hundreds of others. See
this
overview
and this one.
Finally, there is the potential abuse of such technology:
breach of privacy, surveillance and intrusiveness. If a device
attached to you could continuously monitor your vitals and beam
that to your doctor, would you wear it?