The goal of this module is to examine how programming can be
used as a tool in generating art. We've already seen a bit
of this in earlier modules. Here, we will delve a bit deeper.
3.10 Video:
First, recall how to use color
A color needs three numbers: the amounts each of red, green, blue
In an image we've used numbers between 0 and 255.
Drawtool uses a value between 0 and 1 for each color.
Thus, a mostly-red, little green, and no blue can
be specified with:
from drawtool import DrawTool

dt = DrawTool()
dt.set_XY_range(0,10, 0,10)

r = 0.7     # A lot of red
g = 0.2     # Some green
b = 0       # No blue

dt.set_color_rgb(r, g, b)
dt.draw_filled_rectangle(2, 3, 1, 1)
dt.display()
3.11 Exercise:
Type up the above in
my_color.py
and play around with the r, g, b values. Include three
screenshots in your module pdf and describe the r,g,b values
you used.
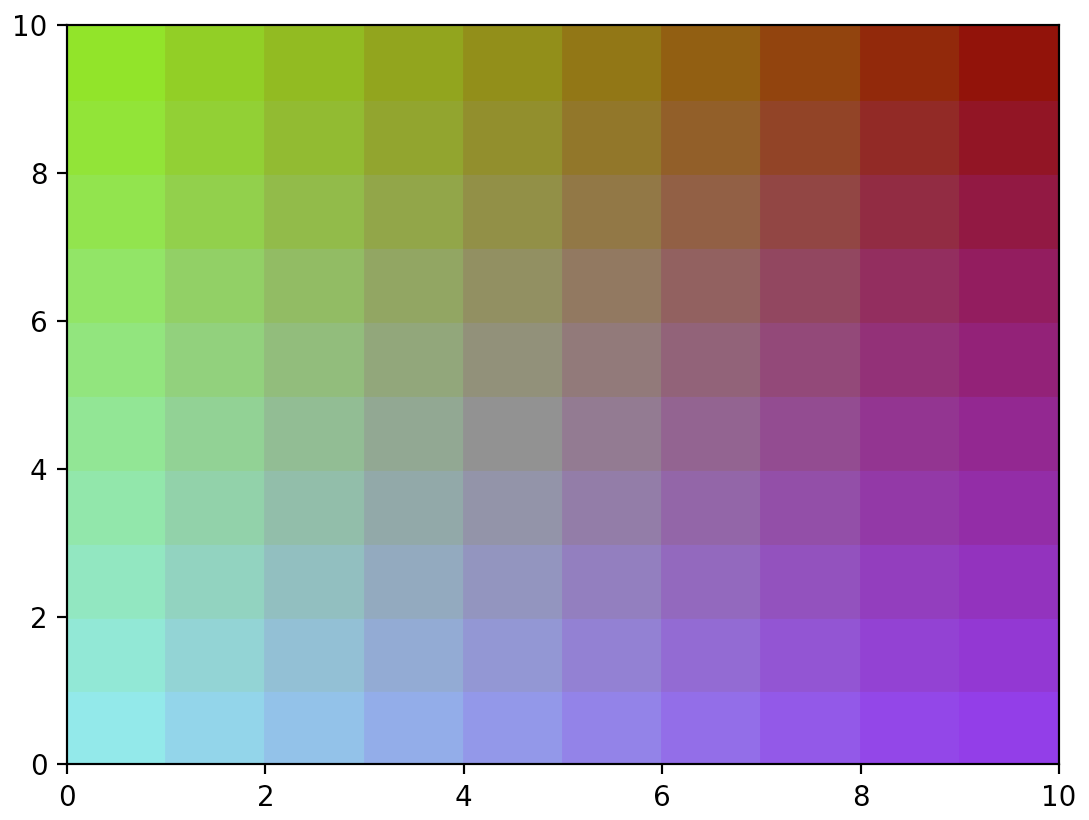
Let's now make this a little more interesting by displaying
a gradation of color:
from drawtool import DrawTool

dt = DrawTool()
dt.set_XY_range(0,10, 0,10)

# This is just avoid printing too many digits after the decimal.
def print_nice(i, j, r, g, b):
    # Recall string formatting from Module 0.
    format_string = 'i={0:2d} j={1:2d} r={2:.2f} g={3:.2f} b={4:.2f}'
    s = format_string.format(i, j, r, g, b)
    print(s)


r = 0.5    # We'll fix r at 0.5 through out
g = 0      # g will change with each row

for i in range(10):

    # Start Blue=0 in each row
    b = 0

    for j in range(10):
        print_nice(i, j, r, g, b)
        # draw a square at x=i,y=j with color r,g,b
        dt.set_color_rgb(r, g, b)
        dt.draw_filled_rectangle(i, j, 1, 1)
        b += 0.1
        # Blue increases across a row

    # Green changes once with each row
    g += 0.1

dt.display()
3.12 Exercise:
Type up the above in
my_color2.py to see
the result. Then, change the loop so that the resulting colors
are
Part A: Artwork with a digital brush
In the real world, a paintbrush is dipped into paint (of whichever
color, sometimes carefully mixed) and then applied.
During a single stroke of the brush, the dipped color is the one
that is seen in the stroke.
In the digital version, we have the option of changing the color
throughout the stroke in any way we like.
The goal of this part is to write code to change the color
(in a gradation) along a brush stroke, and then to use that in
making art.
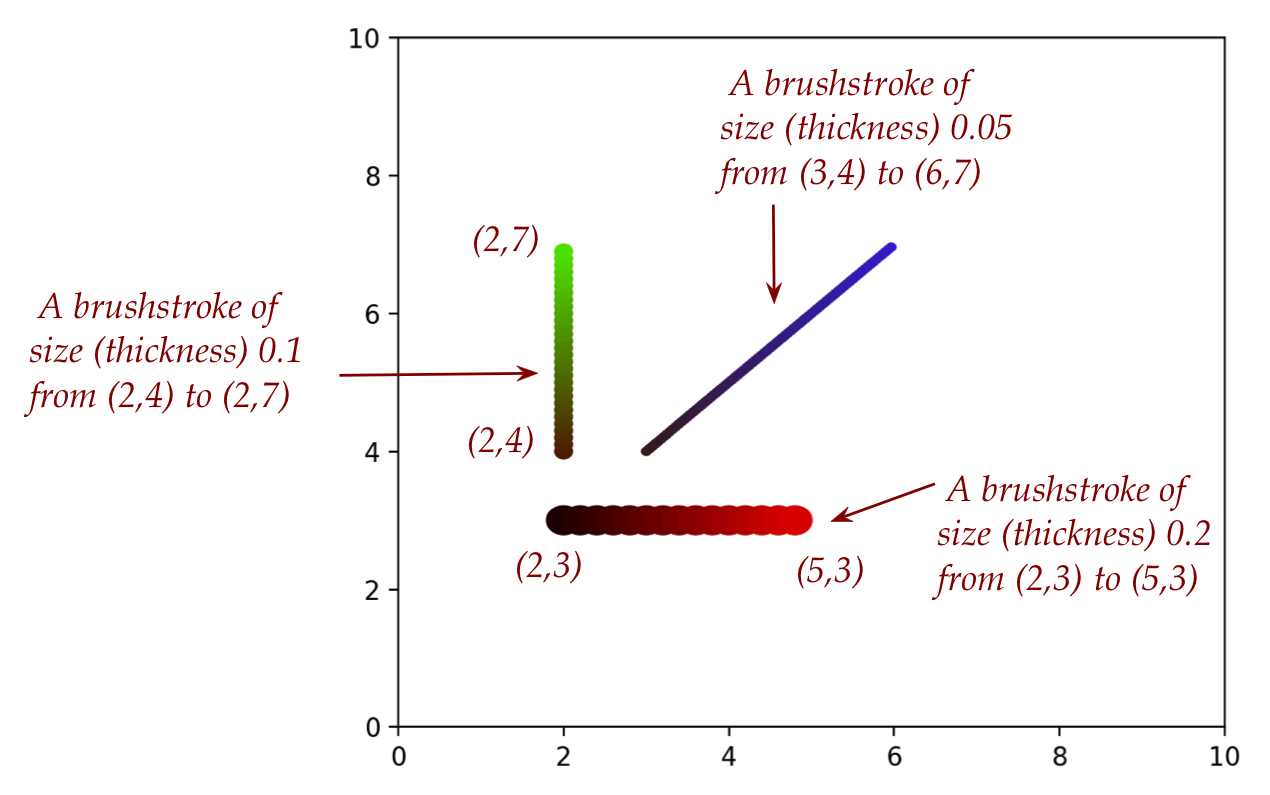
Let's start by writing code to achieve these results:
Notice the gradation of color in each stroke.
Look closely at the thickest one and you'll see that
the rendition of a stroke is really all about drawing a sequence
of color-filled circles.
So, the programming goal is going to be: given a start point
like (2,3) and an end point like (2,5), and a size like 0.2 (which
we'll treat as the circle's radius), determine how many
we'll need.
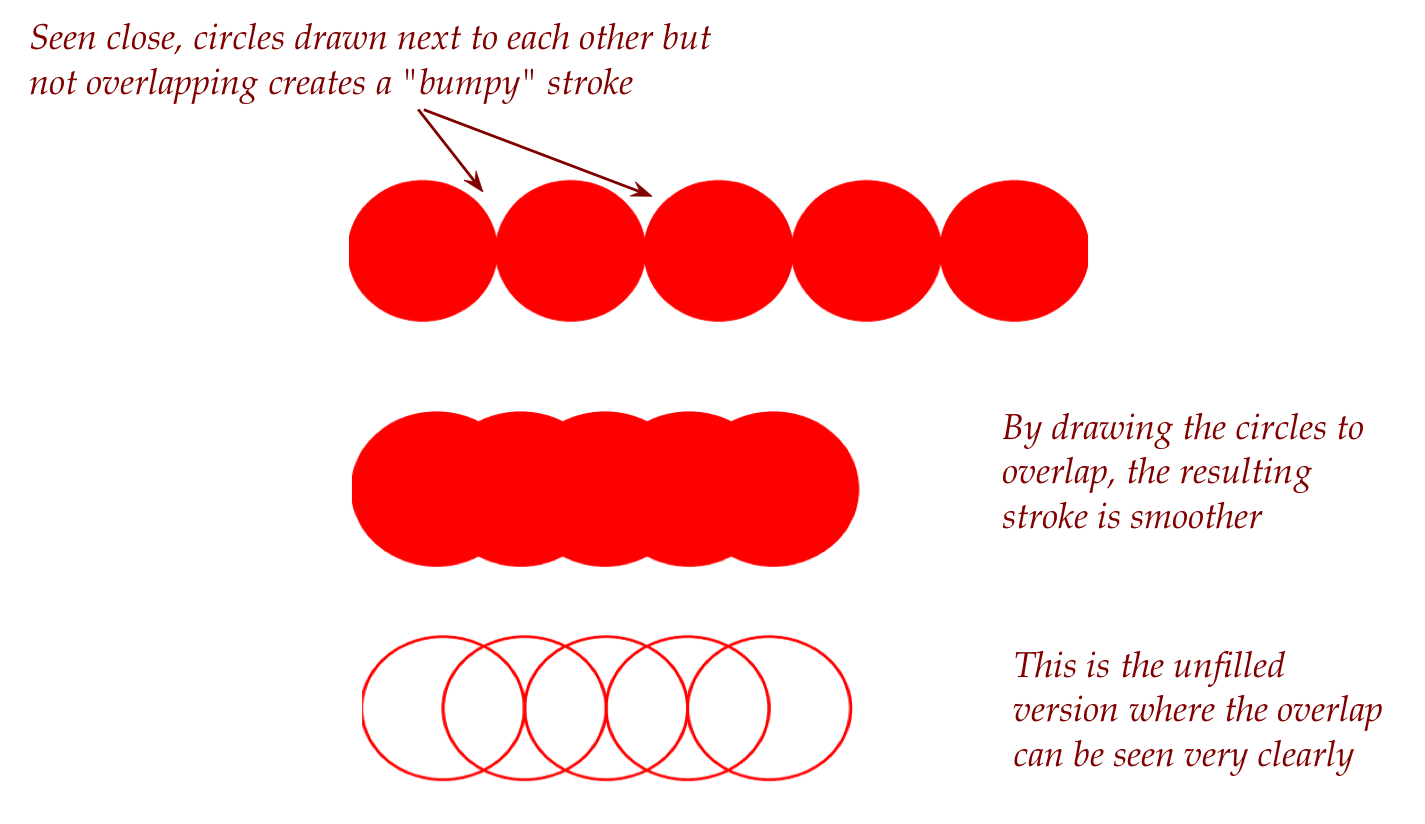
If we drew circles one next to another, only touching,
the result would be unsatisfying.
Here's an example (without a gradation in coloring):
So, we will draw the circles so that the next circle's
center is one radius away from the previous circle's center.
Next, let's look at some test code to see what it tells us
about what we need:
# Set up the parameters: a stroke from (2,3) to (5,3) with radius=0.2:
brush.set_parameters(2, 3, 5, 3, 0.2)

# Compute the number of such circles required:
brush.compute_num_circles()

# Make the gradation of colors using red varying from 0.1 to 0.9,
# and green=0, blue=0
brush.make_red_stroke_colors(0.1, 0.9, 0, 0)

# Draw the result
draw_stroke()
We will provide the code for some of these functions. Your
goal is to write the rest, and later, make some art.
The instructions for what code to write are in comments embedded in
the
brush.py
file.
3.14 Audio:
3.15 Exercise:
The file
test_brush2.py
shows how to draw. In this exercise write code in
my_artwork.py
to apply your brushstrokes. Use at least two loops to
create an interesting effect. Include a screenshot in your
module pdf and explain your ideas: what did you try to achieve
in the code and why? Although most of the drawing should feature
the new brushstrokes, you can also use other functions in drawtool
that you've learned earlier.
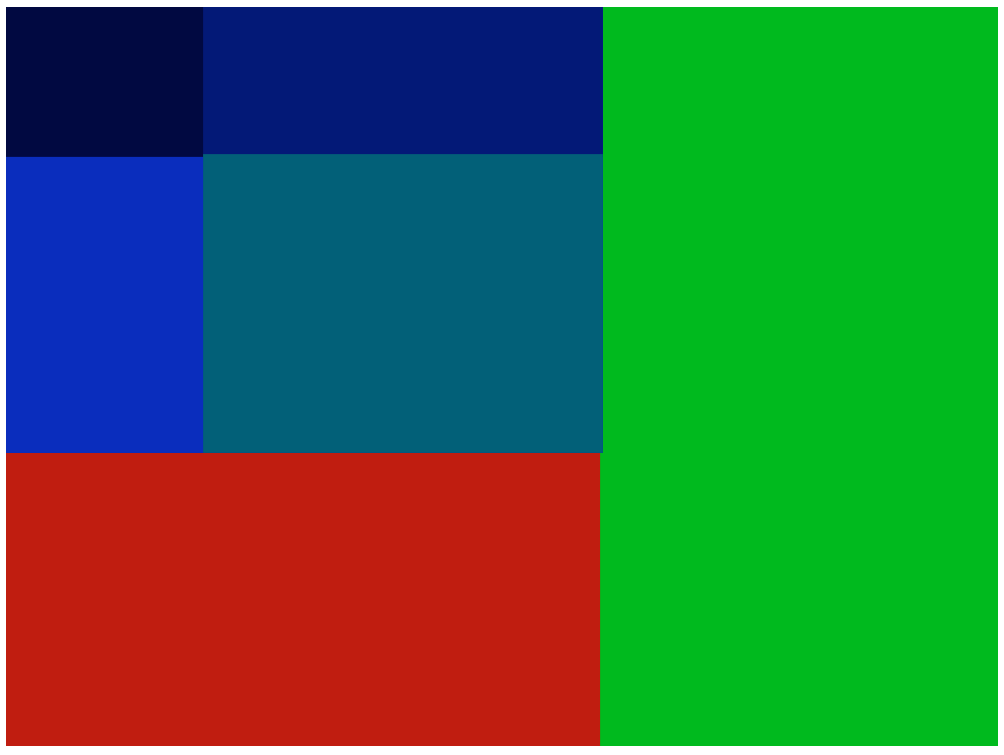
Part B: Chasing Piet Mondrian
Start by reading about
Piet
Mondrian, his life and his art.
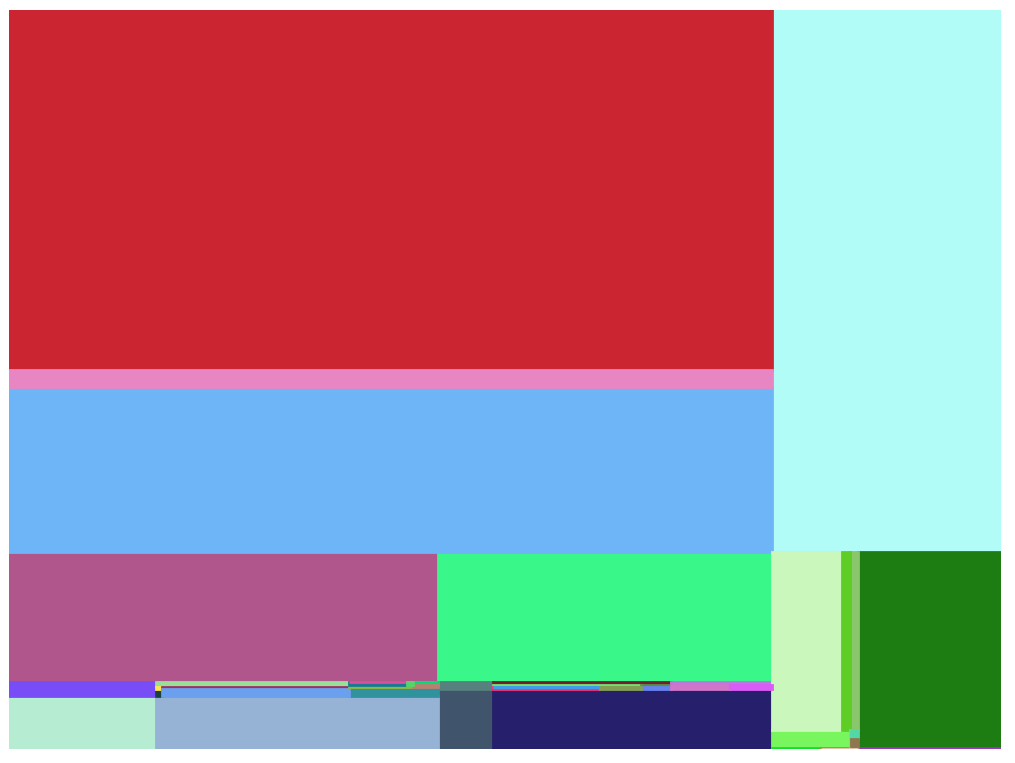
What we're going to do is write code to generate art
with a similar theme.
Here's one simple example (that you will first recreate and then improve on):
Key ideas:
We'll start with one big rectangle (10 by 10). Then we'll
divide that into rectangles. Then, pick a random rectangle, divide
that, and so on.
Throughout, we'll maintain a list of rectangles.
At each step, we'll pick a random rectangle from the
list, for example, the k-th rectangle.
For this rectangle, we will apply one of three kinds
of "splits":
A vertical split.
A horizontal split.
Both a vertical and horizontal split.
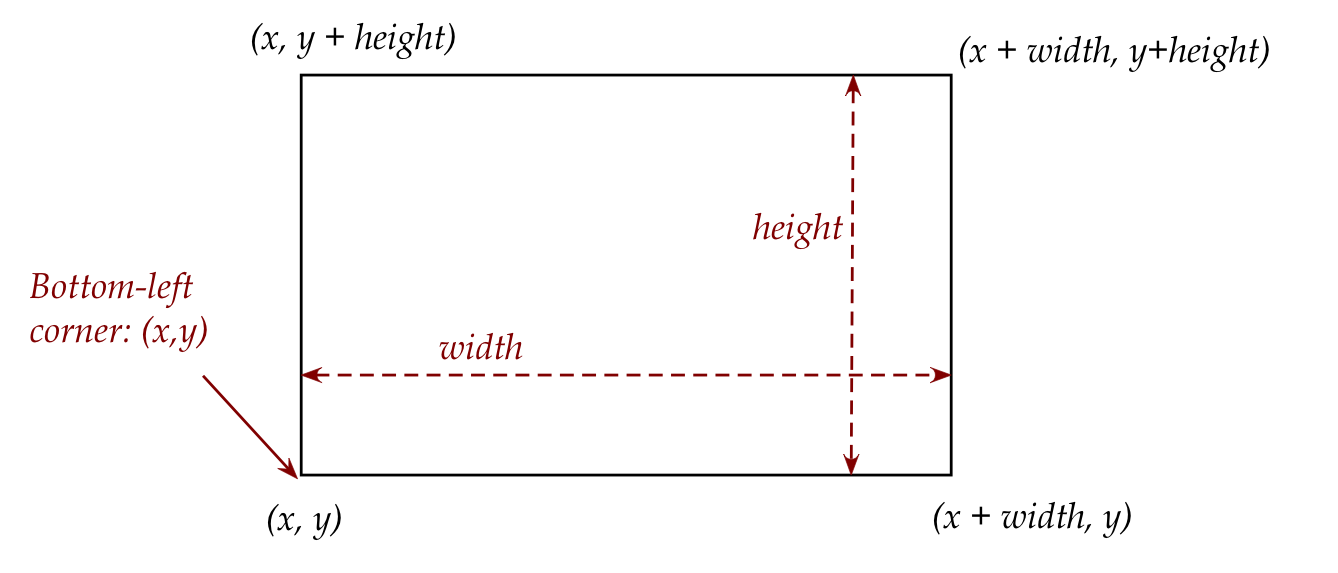
Let's begin by understanding one way of specifying a
rectangle:
With this approach to specifying, a rectangle needs four numbers
Two numbers for the coordinates of the bottom left corner.
One number each for width and height.
These four numbers completely determine the rectangle.
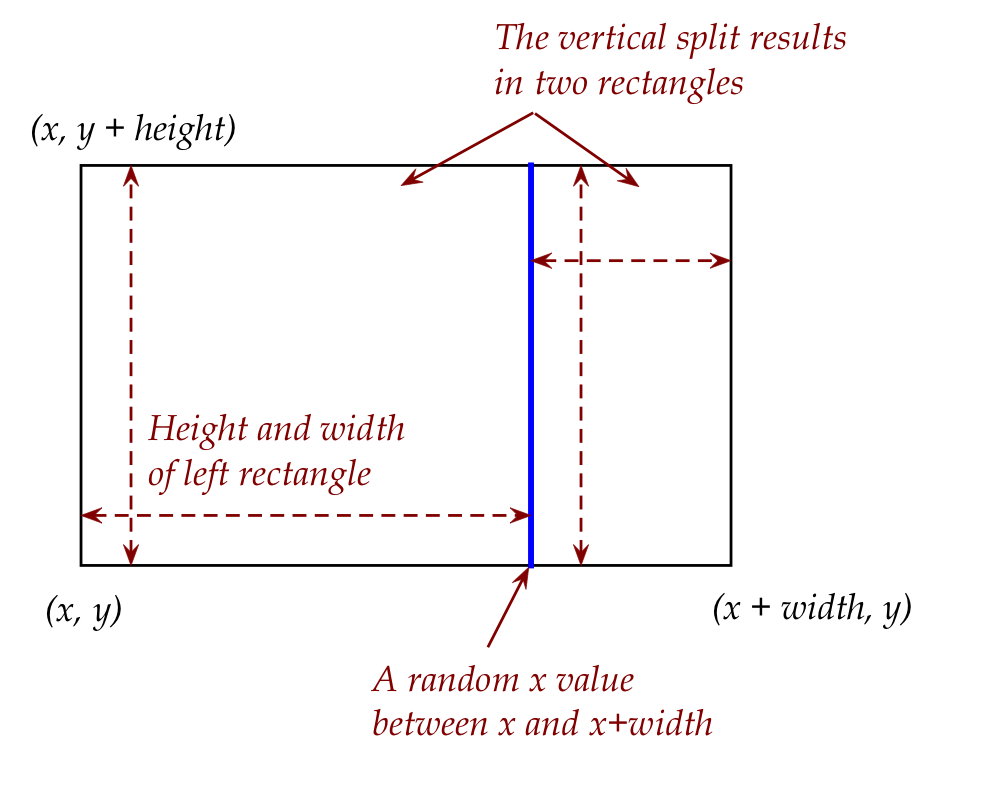
Now let's look at a vertical split:
Pick a random x value between x and x+width:
x2 = random.uniform(x, x + width)
Then, one needs the four numbers for each of the two
smaller rectangles.
The height is the same for both.
For the left rectangle, we need the new width.
For the right rectangle, we need the coordinates of
its bottom-left corner, and its width.
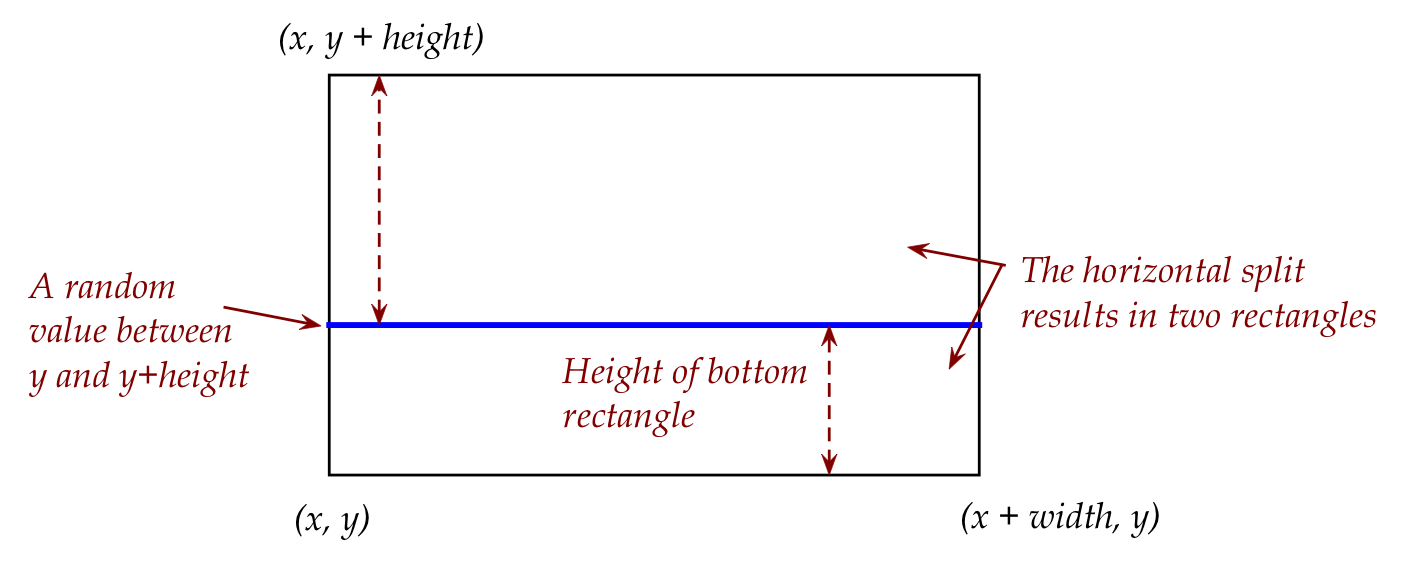
A horizonal split is similar:
Here, we need the height of each smaller rectangle, and the
coordinates of the bottom-left corner of the top rectangle.
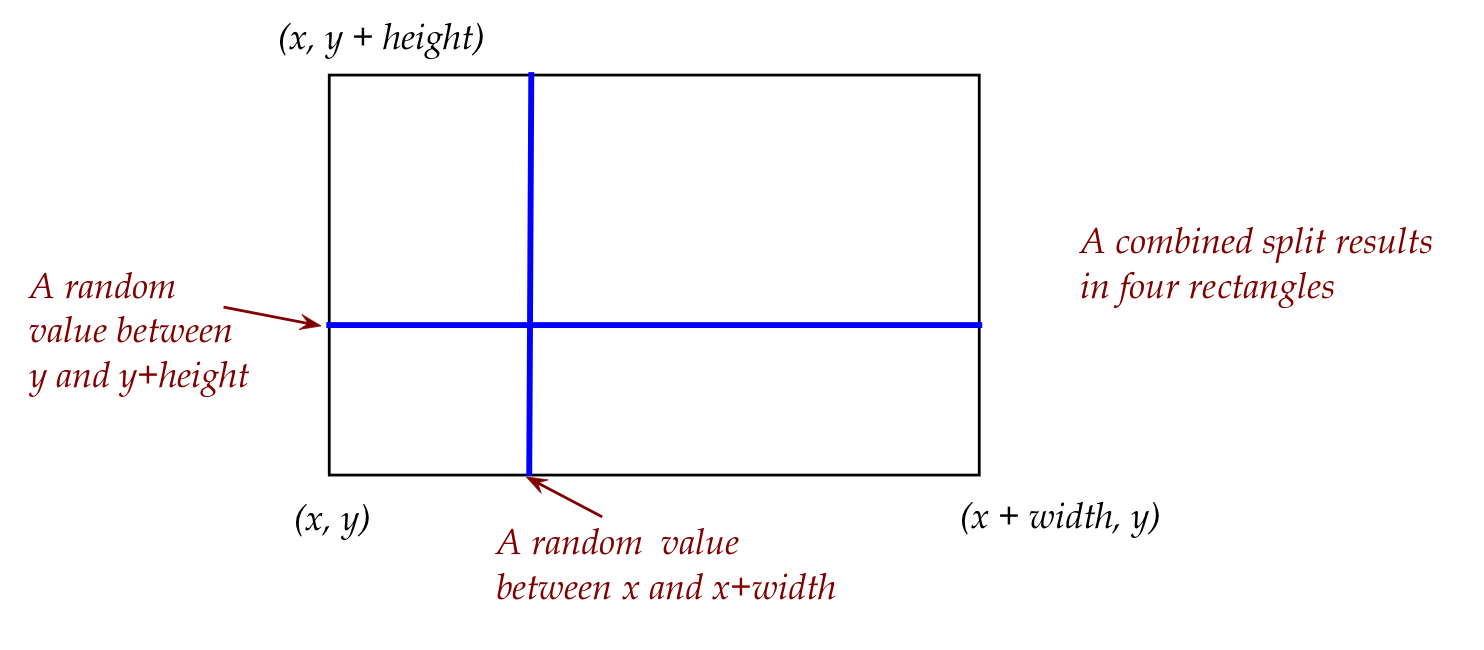
To split into four rectangles, we apply both a
vertical and horizontal split simultaneously:
Can you identify what needs to be calculated?
How do we maintain the four numbers (two coordinates,
width, height) for many rectangles?
The list
bottomX
will have the x coordinate of the bottom left corner of
every rectangle:
bottomX[0] will be x coord of bottom-left corner of rectangle 0
bottomX[1] will be x coord of bottom-left corner of rectangle 1
bottomX[2] will be x coord of bottom-left corner of rectangle 2
... etc ...
Here, we've initialized each list with the numbers for
a single rectangle: bottom left at (0,0) with height 10, width 10.
When we split this rectangle, we'll remove this rectangle
and add the newly created smaller rectangles.
Here's the code for performing a vertical split
of the k-th rectangle in the list:
def split_vertical(k, x):
    # First the left rectangle:
    bottomX.append(bottomX[k])
    bottomY.append(bottomY[k])
    width.append(x - bottomX[k])
    height.append(height[k])

    # Next, the right rectangle:
    bottomX.append(x)
    bottomY.append(bottomY[k])
    width.append(bottomX[k] + width[k] - x)
    height.append(height[k])

    # Remove k-th rectangle
    remove_rect(k)
Note:
The parameter into the function, x, tells the function
where to make the split (which assumes this random x has
been computed elsewhere).
Notice that we're append-ing to each of the
four lists, so the newly created rectangles get added to the end.
Finally, the rectangle being split (rectangle k) is
removed:
remove_rect(k)
(Because it's being replaced by the smaller ones).
3.16 Exercise:
Download
rectangles.py,
and
test_rectangles.py
(you already have drawtool).
Examine the code in
rectangles.py
to understand how vertical split is implemented, and then
fill in the needed code in to achieve horizontal and
both-splits, as directed in the comments.
The file
test_rectangles.py
tests your code (you can read that file to see what it should print).
3.17 Exercise:
Once you have the splits working, download and run
test_rectangles2.py
to see the result of the splits in the above test code. You should
see
(You can un-comment the line
dt.set_axes_off()
to turn off showing the axes. The axes are useful for debugging.)
3.18 Video: TBD
3.19 Exercise:
Now that you have splitting working, download and execute
mondrian.py.
You should see something like the example we first showed at
the top of this section. You can comment out the line
random.seed(123)
to get a different drawing each time, and you can increase the number
of splits. Your real goal is to artistically improve on this
basic framework. Thus, in
my_mondrian.py,
write an improved, more interesting version using better coloring,
all the capabilities of drawtool, and tweaking the splitting procedure.
Submit at least three such drawings in your module pdf, with
the expectation that when we run your program, we'll see the first one.
Art of course goes beyond renderings on flat surfaces.
Yet others are programming devices to interact with each other,
or embedded wireless sensors to have real-life objects interact
with people. See this artist
use robots, for example (look at "The Table" in his gallery).
Computer science also plays a major role in the
analysis of art, for example:
Algorithms can analyze an artwork to determine authenticity,
to study the use of color, or any other aspect.