Consider the percolation problem on a lattice:
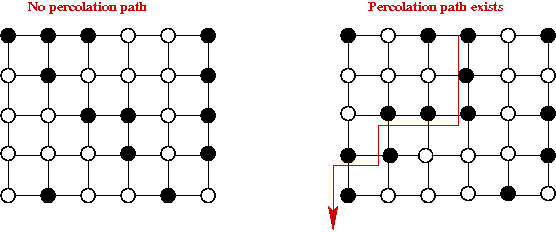
In this problem, you are given an m x n grid of nodes and edges as shown above. The nodes are arranged, grid-like, into m rows and n columns. Each node is either "on" or "off" with probability p. Clearly, if p is small (close to 0), then few nodes will be "on" whereas if p is large (close to 1) then most nodes will be "on".
A vertical percolation path is a path from a node in the top row to a node in the bottom row consisting entirely of "on" nodes. Then, a vertical percolation is said to occur if there is a vertical percolation path. Similarly a horizontal percolation exists if there is a path from a leftmost vertex to a rightmost vertex using only "on" vertices. A percolation exists if either a vertical or horizontal percolation exists.
Thus, if you generate a random grid (that is, create a grid and then turn nodes "on" according to probability p), then there may or may not be a percolation path. Let Q be the probability that a percolation is found. Since this depends on the seed probability p, we'll write this as Q(p). Your goal is to plot the graph Q(p) vs. p for a 20 x 20 mesh. You will need to estimate this function using a large enough number of samples (repeated simulations).
Submission: Demonstrate your program in class and submit a printout of the graph.