Perhaps the simplest way to represent a graph in a computer is by means of an adjacency matrix. For this, we think of the nodes of a graph as being represented by the numbers 0, 1, .. . The adjacency matrix is an X two-dimensional array adjMx of 0 and 1 such that:
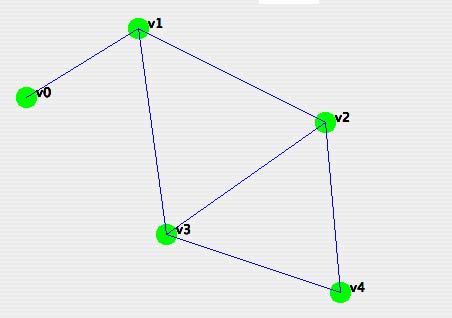
For this graph:
the adjacency matrix is
01000
10110
01011
01101
00110
Theorem: For any graph, the adjacency matrix adjMx is symmetric. In other words adjMx[i][j] = adjMx[j][i] for all possible values of i and j.
This applet generates adjacency matrices for random graphs. You enter the number of nodes that you want (29 is the maximum my display allows) and the density of edges that you'd like. The applet then makes an adjacency matrix with that many rows and columns. The density should be a number between 0 (no edges at all) and 1 (all possible edges included).
Hint: In my program I use the condition (Math.random() < density) to decide whether to include an edge or not.
Hint: Here is code I wrote to provide default values in the case of bad user input:
   JTextField howManyNodes, whatDensity;
   int numNodes;
   double density;

   ...

        try {
            numNodes = new Integer(howManyNodes.getText());
            density = new Double(whatDensity.getText());
        }
        catch (NumberFormatException nfe) {
            howManyNodes.setText("Bad data -- I'll use "+numNodes);
            whatDensity.setText("Bad data -- I'll use "+density);
        }
        if ((numNodes < 1) || (density < 0) || (density > 1)) {
            numNodes = 12;     // default
            density = .3;      // default
            howManyNodes.setText("Bad data -- use "+numNodes);
            whatDensity.setText("Bad data -- use "+density);
        }
   ...