As usual, in each such assignment set, we will help develop your
problem-solving skills by showing you how to solve one
problem, the first and often hardest problem.
Note: the solution will include some exercises
for you that you will need to submit.
Assignment problems
Demo problem.
Consider these three lists:
A = [1, 3, 5, 7, 9, 11, 13]
B = [2, 5, 7, 9, 10, 11]
C = [10, 2, 5, 7, 15, 13]
Notice that the sub-list 5,7,9 in the first list appears
in the second list whereas there is no 3-element sub-sequence in
list A that appears in list C.
The goal of this problem is to write a function that
prints the start position in each list for the first 3-element
sublist found in both, going left to right:
def search_sublist(X, Y):
    # Determine whether and where a 3-element sub-list of X exists in Y.

A = [1, 3, 5, 7, 9, 11, 13]
B = [2, 5, 7, 9, 10, 11]
C = [10, 2, 5, 7, 15, 13]
D = [9, 11, 13, 14, 15]

# This should print: Found: at i=2 in X and j=1 in Y
search_sublist(A, B)

# This should print: No 3-element sublist found
search_sublist(A, C)

# This should print: Found: at i=4 in X and j=0 in Y
search_sublist(A, D)
Such sublist searching is a common operation in dealing with DNA
sequences in biology (except that their sequences have letters and not
numbers).
At this point, do not read further and try to address the following:
First understand what is being asked.
Do you see loops and if so, how would they range over the lists?
Can the problem be broken down into parts, where you can solve
the parts and put the solution together afterwards?
Try writing some code to get at least some of the output.
Don't forget to submit your solutions to the exercises within.
Examine a list of strings and identify whether the list has *composite words* consisting of a concatenation of words already in the list. For example, consider:
x = ['red','blue', 'trees', 'wood','forest', 'field', 'redwood', 'greenfield', 'pasture', 'green']
We can see there are two composites:
x = ['red','blue', 'trees', 'wood','forest', 'field', 'redwood', 'greenfield', 'pasture', 'green']
and
x = ['red','blue', 'trees', 'wood','forest', 'field', 'redwood', 'greenfield', 'pasture', 'green']
Now, write code in composite_word_finder.py to complete the function below:
def find_composite_words(A):
    # write your code here

x = ['red', 'blue', 'trees', 'wood', 'forest', 'field', 'redwood', 'greenfield', 'pasture', 'green']

y = ['hi', 'did', 'sunshine', 'splendid', 'silent', 'sun']

find_composite_words(x)
find_composite_words(y)
The output should be:
Composite words found:
- red wood redwood
- green field greenfield

No composites found
Write code for two functions in the file the_second_best.py:
def second_best(A):
    # write your code here

def best_second(A, B):
    # write your code here

x = [1, 2, 3, 4, 6, 8]
print(second_best(x)) # should print 6
y = [4, 7, 12, 5, 1]
print(second_best(y)) # should print 7
print(best_second(x, y)) # should print 7
The first function returns the second-largest element in a given list. The second function takes two lists, compares their second-largest elements, and returns the larger of the two.
Hint: Refer to Unit 1, Module 2, Section 2.11 and Exercise 2.35.
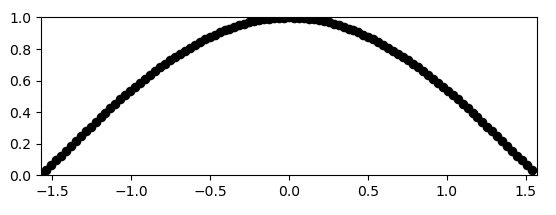
The following shows the plot of the cosine function:
Note: the x coordinate ranges between -1.57 and +1.57, approximately -π/2 and +π/2. Cos(x) takes on values between 0 and 1 for these values of x.
What we would like to do is calculate the *area* below the curve. That is, the area of the shape whose one boundary is the curve, and whose other boundary is the x-axis. We will do this using a method called *Monte Carlo integration* (do not worry about the terminology, you will be able to follow along).
We generate n random points, where the x value is randomly selected between -π/2 and +π/2, and the y value is randomly selected between 0 and 1.
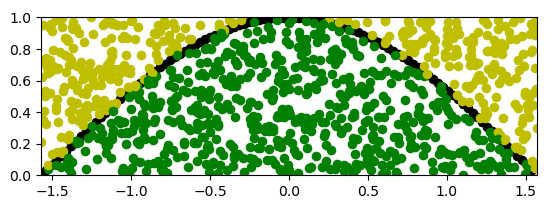
Then, for those points that lie below the cos(x) function, we'll color them green. All other points will be colored yellow.
This will look like:
The ratio of the number of green points to the total number of points (green and yellow) should be a reasonable approximation of the ratio of the area under the curve to the area of the whole rectangle (with sides π and 1).
Your goal is to generate the random points, plot them as shown, and and to count how many lie under the curve.
To generate a random value within a particular range, use:
x = random.uniform(-1.57, 1.57)
to generate a random x value between -π/2 and +π/2, approximately. Since this is an approximation method, using approximate values for π/2 is okay.
Find a TED talk that relates to computing or computer science.
In your
assignment1.pdf,
write the title, include the URL, a little about the speaker,
and a one paragraph summary. Add a second paragraph with your
own views on the topic.
A1.4 Audio:
How to submit:
Write all your programs and assignment1.pdf
in a directory called assignment1.