CHAPTER 4
ADAT AND SMALL ADA OVERVIEW
A programming environment was built to provide a basic software platform in which the main ideas proposed by this research could be tested and evaluated.
Small Ada has its roots in Pascal-S, defined by Nicolas Wirth [Wirt76]. M. Ben-Ari defined CO-Pascal, a modification of Pascal-S that has concurrent features such as COBEGIN and COEND blocks as well as semaphores [Ben-82]. In 1987, F. Hathorn converted CO-Pascal to Small Ada, a subset of Ada [Hath89]. A series of extensions by Arthur V. Lopes began in 1989 [Lope91a, 91b, 91c, 92a, 92c]. The design and implementation of the Small Ada Parallel Monitoring (SAPM) was the first extension. This version of Small Ada was ported and adapted to Apple Macintosh by Manuel Perez, in 1990. It was followed by the Small Ada Integrated Environment (SAIE). An Automated Debugger for Ada Tasks (ADAT) was then integrated with Small Ada. Other extensions and system evaluations were also documented in Lope91d, 92b, and El-K91. For further details on the history of Small Ada, see Appendix I.
The Small Ada system is composed of three major modules:
The integrated environment, SAIE, provides the basic shell in which the user can perform all activities required to work with Small Ada programs. It was adapted from Borland's Turbo Pascal Editor ToolBox [Borl87]. Figure 4.1 shows the SAIE top menu view in which a program has been pre-selected (darker sub-menu item) for compilation and interpretation.
<CtrlJ><CtrlS>
+------------------------------------------------------------------------------+
¦ File Window Text Block Goto Search Options Compiler ¦
+------------------------------------------------------------------------------+
procedure RACE is ¦ Execute SmAda ¦
¦ Macros.. ¦
STIME : FLOAT; ¦ Directory.. ¦
¦ Change directory.. ¦
task BUBBLE_SORT is ¦ Run ADAT ¦
entry S(r : in INTEGER; t : in FLOAT); +----------------------+
entry X;
end BUBBLE_SORT;
task INSERT_SORT is
entry S(r : in INTEGER; t : in FLOAT);
entry X;
end INSERT_SORT;
Figure 4.1 - SAIE Top Menu and Compiler Sub-Menu
The SAIE contains a multi-text full screen editor. It allows the editing of up to six programs. The user can cut and paste text among any of the programs being edited. The Small Ada evaluation studies showed that new users quickly learned the operations required to edit and test a Small Ada program within the SAIE environment [Lope91d, Lope92b].
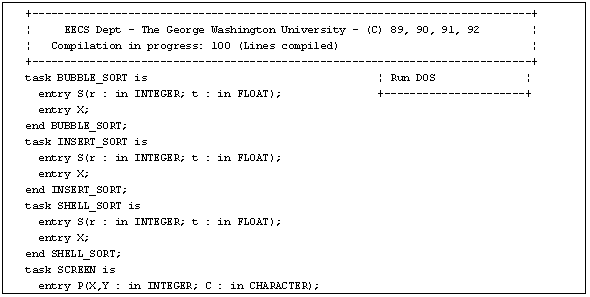
The compiler/interpreter module was derived from CO-Pascal. A Small Ada program is transformed into P-Code form. To allow monitoring and debugging, the scanner, parser and the code generating routines were adapted. Specific P-code instructions were appended with symbol table cursors and source line numbers. The current implementation uses a recursive descent parser. It compiles more than 1,000 lines per minute. This performance is attributed mainly to the changes made in the scanner. It scans the current editor buffer which is located in RAM. This speed can be further increased if the sensors are deleted from the parser. Sensors are used to generate information (stored in a disk file) for the Small Ada Automated Debugger (ADAT). Figure 4.2 shows the compilation screen.

Figure 4.2 - Compilation Screen
The compiler uses the same error recover strategy found in the Turbo Pascal compiler [Borl89]. Figure 4.3 shows the syntax error window. The first syntax error detected suspends the compilation process and, after the user has acknowledged the error message, the user is placed in the SAIE editing mode with the cursor positioned at the beginning of the line containing the syntactic error. In Figure 4.3 the bold lines represent the portion of the code that caused the error.
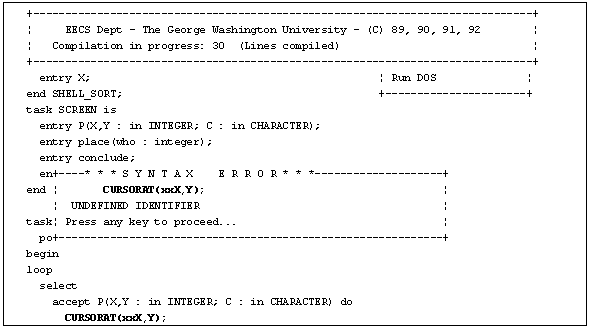
Figure 4.3 - Syntax Error Window
The interpreter fetches and executes a set of 77 P-code instructions. Before the execution of a P-code instruction the SAPM driver is activated, allowing the user to select any of the SAPM options before the program's execution. After a Small Ada program free of syntax errors is compiled, the SAPM control panel is displayed. Figure 4.4 shows the SAPM control panel.

Figure 4.4 - SAPM Control Panel
The first SAPM version was designed and implemented in the spring of 1989. The outcome of the project motivated further work. The system has received substantial improvements [Lope91b, Lope91c, Lope92a, Lope92b, Lope92c, El-K91]. It has also been ported to the Mac by Manuel Perez. The current version for the PC now runs in an integrated environment, SAIE. It turned out that Moran's recommendations for the continuation of her work [Mora85] were accomplished in full with the advent of the SAPM. A previous development was the educational software SAEED. In this project, the basic data structures studied in a Data Structure class were implemented in a simulator that showed the user how these data structures were modified under the control of their associated algorithms. The user could see in detail how a particular data structure changed under control of its associated operations. The line of the algorithm that is being executed is highlighted and the execution can progress in a step by step mode or under control of the simulator, which can run at user-requested speed. In addition, all of its control variables and main data structure are shown. Figure 4.5 shows a screen dump of a circular queue simulation just before the insertion of its first element.
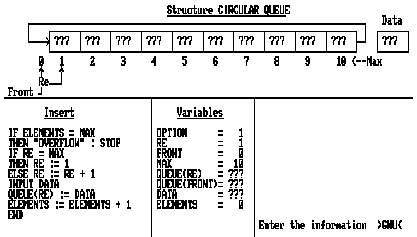
Figure 4.5 - SAEED Screen Dump
The SAPM implements the same idea, i.e., it lets the user see the instructions that are being executed for each task. SAPM allows the monitoring of any Small Ada program automatically at the source code level. Most of the monitors studied in the literature make use of a pre-processor that attaches monitoring calls to the source code, thus changing the original source program. This approach makes debugging even more difficult because the monitoring becomes intrusive and thus allows for changes in the non-deterministic aspects of the concurrent program. SAPM does not change the source code and all transformations required for the parallel monitoring to work are user transparent. Figure 4.6 shows a screen dump of the SAPM.

Figure 4.6 - SAPM Screen Dump
Each task has a fragment of its source code displayed in a specific window. The current version projects four windows on the screen. Programs with more than three declared tasks (the main program is considered a task) pose the problem of determining which window should be preempted from the screen in order to allow space for an incoming window. The current version of SAPM resolves this conflict by using a window scheduler that preempts the window that is associated with the task that possesses the smallest degree of activity since the last preemption. The degree of activity here is measured by the number of p-code instructions executed. We name this problem task monitoring resolution. Each window has three basic components. The window label, located at the upper left corner, is a substring of the task name. The main Ada program is labeled main. The second component is the code segment. A fragment of the task source code that surrounds the line being executed is projected onto its associated window. The highlighted line in each window indicates the line that is being processed. The third component is the status mark. The status mark is used to show the current state of each task. The bottom line gives a brief summary for the status marks. In Figure 4.6, four windows are active for a program that has five tasks. The window labeled main is not being projected onto the screen. In the right lower part of the screen, the words Step On appear in vertical. This indicates that the program execution is halted after one p-code instruction is processed. The user must press the space bar key to make the execution continue. The literature survey revealed that the simultaneous monitoring of several tasks is a unique SAPM feature.
The user may set the SAPM options on and off and then request the program's execution to commence. The debugging capabilities provided by ADAT are discussed later within this chapter.
The Inspect Trace feature allows the visualization of events related to task interactions as well as changes in scalars. When the trace feature is active, the interpreter generates a trace file in text format. A small version of the SAIE editor is invoked with this text file each time the inspect trace option is requested. To activate the trace feature, the user must first depress the F3 and then the F2 key. Figure 4.7 shows an inspect trace screen dump of an instance of the sort race demonstration program execution.
The first three lines displayed show that the task SCREEN executed two attempts to establish a rendezvous with a caller for the entry PLACE and one attempt to establish a rendezvous with a caller for the entry P. The left column shows the internal clock at the time that each event was recorded. The second column shows the task that is being executed. For task interactions, the third, fourth and fifth columns show the rendezvous activity that is being performed, the entry name, and the source line lumber and text, respectively. The fourth line, with the clock set at 22:53:51.79, shows that the variable STIME was just updated within the task MAIN, with a value 9.327E+06, resulting from the execution of the assignment statement STIME := CLOCK + 3.0, located in the source program at line 201. The sequence of operations shown between the clock intervals 22:54: 2.61 and 22:54: 4.86 indicates that a rendezvous was established between tasks INSER_SORT and MAIN for entry S. The entry call came from task MAIN. Two objects, ROW, and STIME, were updated under control of task INSERT_SORT.
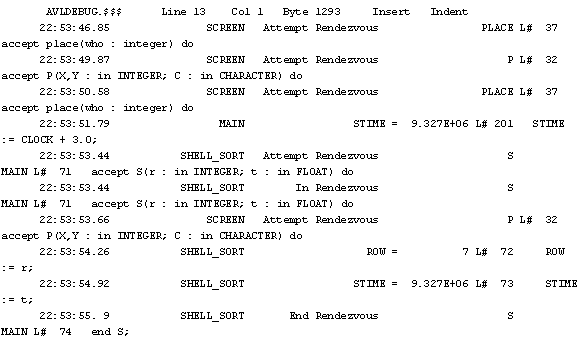
Figure 4.7 - Inspect Trace Screen Dump
The show CPU consumption option displays the CPU consumption in terms of the number of P-code instructions executed, of each task in a pie chart. The F6 key is used to activate the show CPU consumption feature. Figure 4.8 shows the CPU consumption screen dump of an instance of the sort race demonstration program execution, at the same clock that originated the data displayed within Figure 4.7.
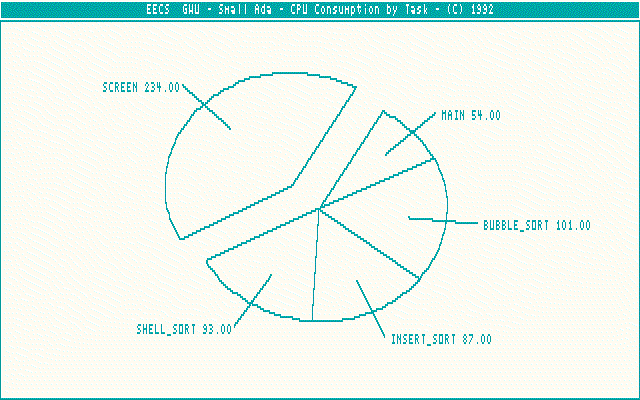
Figure 4.8 - CPU Consumption Screen Dump
The show execution replay feature allows the visualization of how the task progresses, in terms of P-code instructions executed, through an animation scheme. Each task is represented by a rectangle. The top part of each rectangle contains the name of the task that it represents. Tasks move horizontally, initially from left to right. When a task reaches a screen boundary of the screen, it reverses direction. The bottom line of the screen shows, in text format, the tasks that are in rendezvous. When the trace feature is active, the interpreter stores data associated with each rendezvous related operation to a disk file. When the show execution replay is selected, the contents of this file are used to provide the animation in replay mode. The program state is maintained in suspension until the control is passed back to the interpreter. Within the animation screen, the user may be returned to the normal program execution by depressing a single key. To obtain the task animation screen, the user must depress the F4 key. Figure 4.9 shows the task animation screen dump that reflects how far the tasks progressed before the first program's rendezvous was initiated.

Figure 4.9 - Task Animation Screen Dump
Considering the classification of tools shown in table 3.1, SAPM is type 1, 2, 3 and 4.
Existing monitors and debuggers attempt to describe the behavior of the program instead of guiding the programmer in understanding the appropriate logical development of concurrency. ADAT (Automated Debugger for Ada Tasks) is a tool for assisting in the identification and correction of task communication related bugs. This tool was designed for novice Ada programmers learning concurrency. ADAT is an expert system that analyzes information generated by Small-Ada. ADAT gives the user specific advice and guidance for correcting an Ada task communication problem. The main goal of the ADAT is to help the user learn how to identify and correct task communication problems.
Debugging concurrent programs is regarded as a complex and difficult task. The use of expert systems to assist the debugging process has only recently received some attention. Knowledge-based debugging has been used for detection and partial elimination of bugs in computer programs. Examples of knowledge-based systems include PUDSY [Luke80], PROUST [John85], LAURA [ADAM80], FALOSY [SEDL83], and YODA [LeDo86]. In general, knowledge-based debugging systems use some form of program specification and specific information about the source code of the program being debugged. Production systems are also being used for modeling human cognition and learning [Klah87]. Anderson [Ande83, 87, 88] states that "if these systems, are in fact, good models, they could form the bases for pedagogical applications."
ADAT uses some of the techniques used in EDEN for the detection of potential tasking communication deadlocks. While EDEN's purpose is to collect and report run-time information concerning inter-task actions (according to Chen88), ADAT collects compile-time information and attempts to issue a precise recommendation for correcting a task communication anomaly.
Unlike many other knowledge based debuggers, ADAT does not rely on any sort of program specification to assist in the detection of a bug related to communication between tasks. Instead, ADAT uses production rules that synthesize the knowledge of an expert Ada concurrent programmer and selected specification information about the source program generated automatically by an enhanced Small-Ada system. In working with ADAT, four kinds of communication related problems between tasks have been identified. Some of these problems are referred in the literature as task sequencing and deadness errors. Taylor and Osterweil [Tayl80] have identified some of these anomalies when working with static data flow analysis. These problems will be referred to here as Task Communication Anomalies (TCA). Figure 4.10 shows the architecture of the ADAT system.
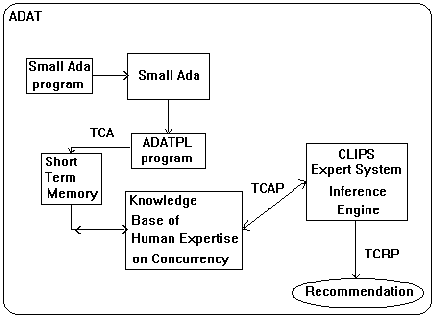
Figure 4.10 - Architecture of ADAT
Taylor and Osterweil [Tayl80] presented algorithms for detecting errors and anomalies for communication between concurrent programs by using static data flow analysis. They also categorized several classes of errors which were also referred to as anomalies. These errors are [Tayl80]:
Referencing an uninitialized variable;
A dead definition of a variable;
Waiting for an unscheduled process;
Scheduling a process in parallel with itself;
Waiting for a process guaranteed to have previously terminated; and
Referencing a variable whose value is indeterminate.
The expert system is written in CLIPS [Giar89a, Giar89b] and is interfaced with Small-Ada [Hath89, Feld90a, Lope91a, Lope91b, Lope91d]. Small-Ada was modified to generate information that allows the detection of a task anomaly [Lope91c]. After a Small-Ada program is compiled and executed, ADAT examines this information to detect a task anomaly. If a task anomaly is present, ADAT issues a recommendation for solving it. Task anomalies possess specific patterns. These patterns are matched with the antecedents of production rules. We will refer to the problem of providing information for the detection of these patterns as Task Communication Anomaly Patterns (TCAP). Once an instance of a TCA is matched against a TCAP, a recommendation can be issued to guide the programmer on how to correct the TCA. We will refer to this kind of recommendation as Task Communication Reorientation Procedure (TCRP). For each TCA, associated TCAPs and TCRPs must be defined.
4.7.1. Task Communication Anomalies
Several anomalies were identified and implemented within ADAT. These anomalies, while simple, represent common problems like those found in the task sequencing errors and deadness errors presented in introductory courses where students are exposed to concurrency [Jack91]. Classical examples of such problems are also found throughout the literature [Deit84], [Chen87] and [Mora85]. The discussion provided by Taylor & Osterweil [Tayl80] and Hough & Cony [Houg89] also serves to support the decision of selecting such errors.
The server anomaly occurs if an Ada program has a task that can accept only one call but the program allows for more than one entry call to be issued. In this situation, the programmer failed to program the construct surrounding the accept statement so that more than one accept can be performed. Program Pgm1, shown in Appendix C, exemplifies a server anomaly occurrence.
The circular dependence anomaly occurs if the situation depicted in the following lines of code is identified:
1. TASK BODY A ... B.E; ... ACCEPT E; ... END A;
2. TASK BODY B ... A.E; ... ACCEPT E; ... END B;
A possible execution sequence would cause the entry call B.E (line 1.) to be executed, causing task A to wait for the rendezvous with task B at entry E. Eventually, the entry call A.E (line 2.) would be executed, causing task B to wait for a rendezvous with task A. This illustrates the circular dependence anomaly also known as circular deadlock. Figure 4.11 shows a program that exemplifies a possible solution for the circular dependence anomaly shown in Program C_DeadLock within Chapter Two.
Having a set of erroneous patterns associated with correct ones makes it possible to supply guidance on how to correct a concurrent program. The above program shows how the idea expressed within the original program (C_DeadLock) containing the circular dependance anomaly can still be expressed, but without the occurrence of deadness errors. The process of task transformations was studied by Hathorn [Hath88], who defined the concept of concurrent structured programming.
WITH Text_IO; USE Text_IO;
PROCEDURE C_DC IS
TASK A;
TASK B;
TASK Server IS
ENTRY AB_E1;
ENTRY BA_E1;
ENTRY A_E1;
ENTRY B_E1;
END Server;
TASK BODY A IS
BEGIN
Server.AB_E1;
Server.A_E1;
Put_Line("A is done.");
END A;
TASK BODY B IS
BEGIN
Server.BA_E1;
Server.B_E1;
Put_Line("B is done.");
END B;
TASK BODY Server IS
A, B : Boolean := FALSE;
BEGIN
LOOP
SELECT
WHEN NOT A =>
ACCEPT AB_E1 DO
A := TRUE;
END AB_E1;
OR
WHEN A =>
ACCEPT A_E1;
A := FALSE;
OR
WHEN NOT B =>
ACCEPT BA_E1 DO
B := TRUE;
END BA_E1;
OR
WHEN B =>
ACCEPT B_E1;
B := FALSE;
OR
TERMINATE;
END SELECT;
END LOOP;
END Server;
BEGIN
NULL;
END C_DC;
Figure 4.11 - Solution for the Circular Dependance Anomaly
An initialization anomaly occurs if a non empty set of tasks makes use of global data that is initialized at declaration time by a parent task. Since the tasks begin executing at the same time and the initialization may be performed at run-time, it is possible for the tasks to use global objects containing wrong values. In addition, global variables that are used by a set of tasks which perform read and/or write operations on their values without any control are also considered within this anomaly. Program Pgm0, shown in Appendix C, exemplifies an occurence of the initialization anomaly.
ADAT was also programmed to deal with the update anomaly which was discussed in Chapter Two. Program Pgm2, shown in Appendix C, exemplifies an update anomaly occurrence.
4.7.2. Task Communication Anomaly Patterns
In order to represent the environment surrounding the communication constructs of tasks, a pseudo language will be used. This pseudo language is referred here as ADATPL. Ada programs are translated into ADATPL and then examined by ADAT. Next the syntax of ADATPL in a BNF like notation is described below:
D <object name> <line number>
where D represents the specification of an object which is not initialized.
Di <object name> <line number>
where Di represents the specification of an object which is initialized.
Rv <task name> <object name> <line number>
where Rv represents the "read" operation over an <object name> within task
<task name> at the source line <line number>.
Rw <task name> <object name> <line number>
where Rw represents the "write" operation onto an <object name> within task
<task name> at the source line <line number>.
E<task name> <entry name> <line number>
where E represents the specification of a task entry.
This construct indicates that the specification part of task <task name> has an entry named <entry name> declared at line <line number>.
T<task name> <line number>
where T represents the beginning of a task body.
This construct specifies that the body of <task name> starts at <line number>.
Te <task name> <line number>
where Te represents the end of a task body.
This construct specifies that the body of <task name> ends at <line number>.
<select environment> E-C <task name> <entry name> <line number>
where E-C represents the specification of an entry call.
<select environment> ::= | S | L S
where:
S represents the select statement and
L S represents the select statement within a loop statement.
This construct specifies the environment in which an entry call is being issued to an entry named <entry name> of <task name> located at <line number>.
The <select environment> specifies:
-if the call is unconditional (the null option); or
-if the call is surrounded by the select statement (timed or conditional),
in this case just S; or
-if the call is surrounded by the select statement and the select
statement in turn is surrounded by a loop statement, in this case L S.
<select environment> ACC <task name> <entry call> <line number>
where ACC represents the accept statement.
This construct specifies the environment in which an accept statement appears. The <entry call> specifies the name of the <entry> of <task name>. The accept statement is located at <line number>.
The <select environment> specifies:
-if the accept is unconditional (the null option); or
-if the accept is a "selective-wait" (see LRM 9.7.1 [DoD83]), in this case just S; or
-if the accept is surrounded by the select statement and the select statement in turn is surrounded by a loop statement, in this case L S.
<select environment> Te <task name> <line number>
where Te represents the terminate statement.
This construct specifies that a selective-wait (starting with either L S or S and followed by ACC has a terminate alternative.
The actual ADATPL syntax is the result of an initial attempt to derive information about the task's communication constructs from an Ada program. As our work progresses, ADAT will reflect more of the various possibilities allowed by the standard concerning both entry calls and accept statements.
For example, the TCAP for the server anomaly is captured by the left hand side (LHS) of a CLIPS's pseudo rule. Figure 4.12 shows the LHS pseudo rule for the server anomaly.
IF there is an entry call for entry E of task T at line number N1 AND
there is another entry call for entry E of task T at line number N2 AND
N2 is not equal to N1 AND within task T there is one accept statement at line number N3
AND this accept statement is not surrounded by a loop construct
AND within task T there is no other accept statement
Figure 4.12 - LHS Pseudo Rule for the Server Anomaly
4.7.3. Task Communication Reorientation Procedure
Every TCAP has an associated TCRP. For example, the TCRP for the server anomaly has the following right hand side (RHS) of a CLIPS pseudo rule. Figure 4.13 shows the RHS for the server anomaly.
THEN
A server anomaly has been detected in your source program <name-of_file>: Your program has at least two entry calls for entry E of task T which are located at lines N1 and N2.
However, within task T, only the first call will initiate a rendezvous. After this rendezvous is completed task T will terminate. Then the next call will attempt a rendezvous with a task that is no longer active. This will cause your program to be interrupted.
My recommendation is:
Enclose the accept statement that is located at line number N3 with the following construct:
LOOP
SELECT
ACCEPT -- code from line N3 should follow
OR
TERMINATE;
END SELECT;
END LOOP;
Figure 4.13 - RHS for the Server Anomaly
The TCAPs and TCRPs for the other anomalies are presented in Appendix H.
Considering the classification of tools presented in Table 3.1 ADAT is Type 5. The features incorporated into Small Ada, specially ADAT, make an efficient tool for teaching concurrency available. Instructors do not need to spend extra time preparing plans for each program, as in PROUST, and students have an easy-to-use programming environment. In addition, further developing ADAT can allow the identification and correction of a wider range of programming bugs, both sequential and concurrent.
Table 4.1 shows the debuggers/monitors taxonomy, first presented in table 3.1, with the inclusion of Small Ada.
Still, there is a problem area in which the ADAT approach can not be used at the present time. These problems are related to errors like the block dependence anomaly, and more complex programs like the gas station example given in Chapter Three. Many changes in the way software is exploited must take place before the ADAT's scope of usage can be enlarged. Some of these changes include the formal regulation of the software activity and increasing funding for the software education community.
TOOL |
TYPE |
HELP |
DbxTool |
1 |
to inspect the program's state |
YODA |
1 |
to perform queries on the history of the program's events |
MORAN |
2 |
to visualize task communication events |
CPEM |
2 |
to visualize process's activities |
MAD |
2 |
to visualize process's relationships and performance |
VESTAL |
2 |
to visualize intertask interactions |
BELVEDERE |
3 |
to visualize user defined abstractions |
PIEMON-1 |
3 |
to visualize user defined abstractions |
MON |
4 |
to locate and identify the problem |
EDEN |
4 |
to locate and identify the problem |
PPD |
4 |
to locate and identify the problem |
PROUST |
5 |
to locate, understand and correct a predefined program |
Small Ada |
1..5 |
data inspection, visualize inter task interactions, and to locate, understand and correct a concurrent program |
Table 4.1 - Revised Tools and the Kind of Help Given
A major contribution of this research is the development, implementation, and evaluation of a new debugging approach. A set of rules that identify task communication anomalies have been elaborated and implemented in a CLIPS program to test the approach. The LHS of these rules detect race conditions, circular deadlocks and illogical uses of passive and active tasks, here named initialization, circular dependence anomaly, update anomaly and server anomaly, respectively. Most of the RHS of these rules direct and guide the user to the correction of each anomaly.